

Concepts: functions and their graphs
Relations and Functions24 min readLesson 3 of 6
3.1 What makes a relation a function
A function is a relation with a stricter promise: every element of the first set must have exactly one partner. The phrase has two halves. Every element of A must appear as a first entry, so no one is left without an image. And no first entry may repeat with a different second entry, so the image is unique.
This is why a relation given by (1, 3), (1, 5), (2, 5) is not a function. The first entry 1 appears twice, with images 3 and 5, so the promise of a single image breaks. By contrast, (2, 1), (3, 1), (4, 2) is a function, because 2, 3 and 4 each appear once. Both 2 and 3 map to 1, and that is allowed; several inputs may share an output.
A relation that misses an element of the first set also fails. If the domain set is {1, 2, 3, 4, 5, 6} and the pairs stop at (5, 6), then 6 has no image, so the relation is not a function. When a question gives you a roster, check the first coordinates for missing values and repeated partners before anything else.
3.2 Domain, codomain and range in practice
For a function f: A to B, the domain is fixed as A. The codomain is B, and the range is the set of values f(x) over all x in A. The range can be smaller than the codomain, and finding it is a regular exam task.
For a rule given by a formula, the natural domain is the largest set of real numbers for which the expression makes sense. A fraction excludes values that make the denominator zero. A square root, when it appears in a real function, requires the expression inside to be at least zero. Polynomials have no such restriction, so their natural domain is all real numbers.
Once the domain is known, the range follows by asking which outputs are reachable. For f(x) = x squared, squares are never negative and every value at least zero is attainable, so the range is the set of non-negative reals. For f(x) = 2x - 5 on the reals, every real output is reachable, so the range is R.
3.3 Graphs of the standard functions
The graph of f is the set of points (x, f(x)) in the plane. Each standard function has a shape worth recognising instantly.
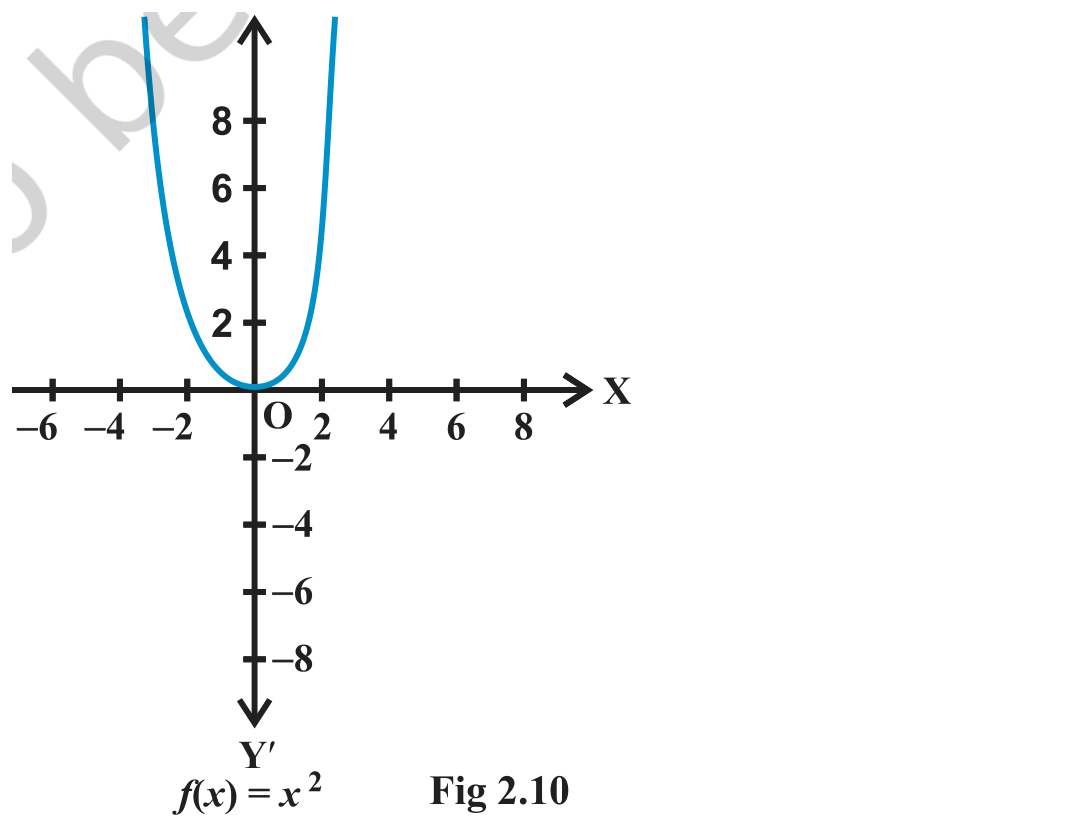
The identity function f(x) = x gives the straight line through the origin at 45 degrees. A constant function f(x) = c gives a horizontal line at height c. A linear function f(x) = mx + c is a straight line with slope m. The square function gives a parabola opening upward, and the cube function rises from bottom left to top right, passing through the origin with a flat moment there. The reciprocal function splits into two branches around the y axis and never touches either axis.
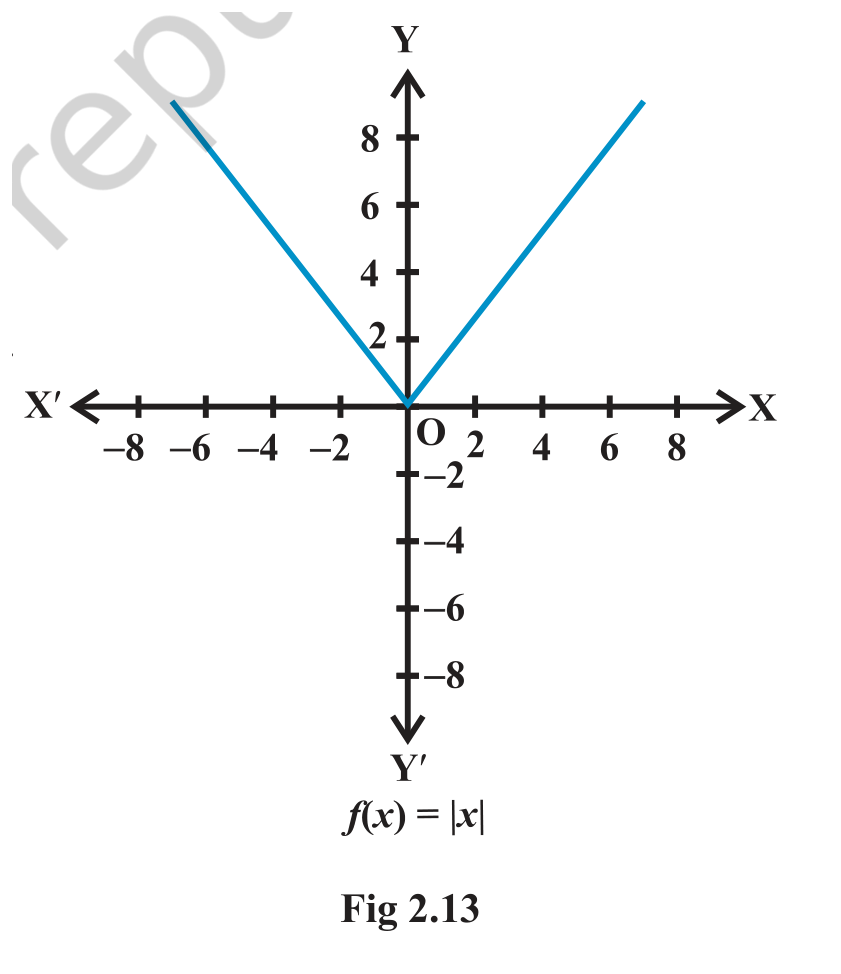
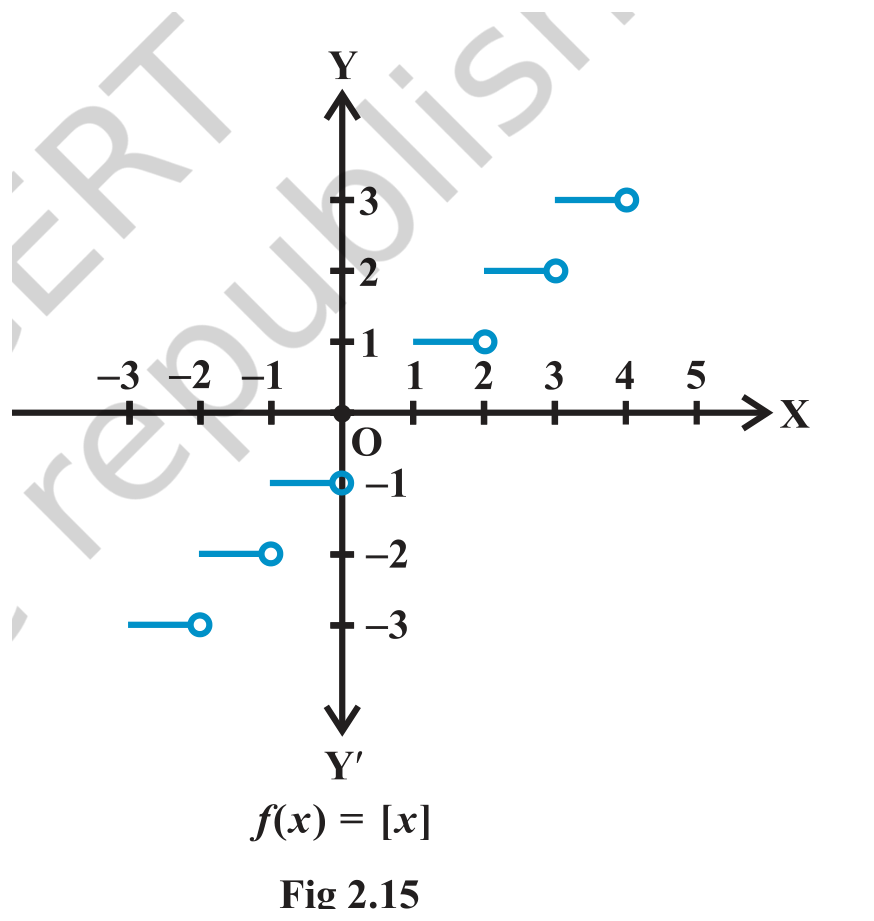
The modulus function returns the distance of x from zero, so negative inputs are reflected upward and the graph is V shaped with its corner at the origin. The signum function records only the sign, giving -1 for negative inputs, 0 at zero and 1 for positive inputs, so its graph is three horizontal steps. The greatest integer function rounds down, so it produces a staircase with jumps at every integer.
Slideshow, slide 1 of 4. Use the left and right arrow keys to change slides and the space bar to play or pause.
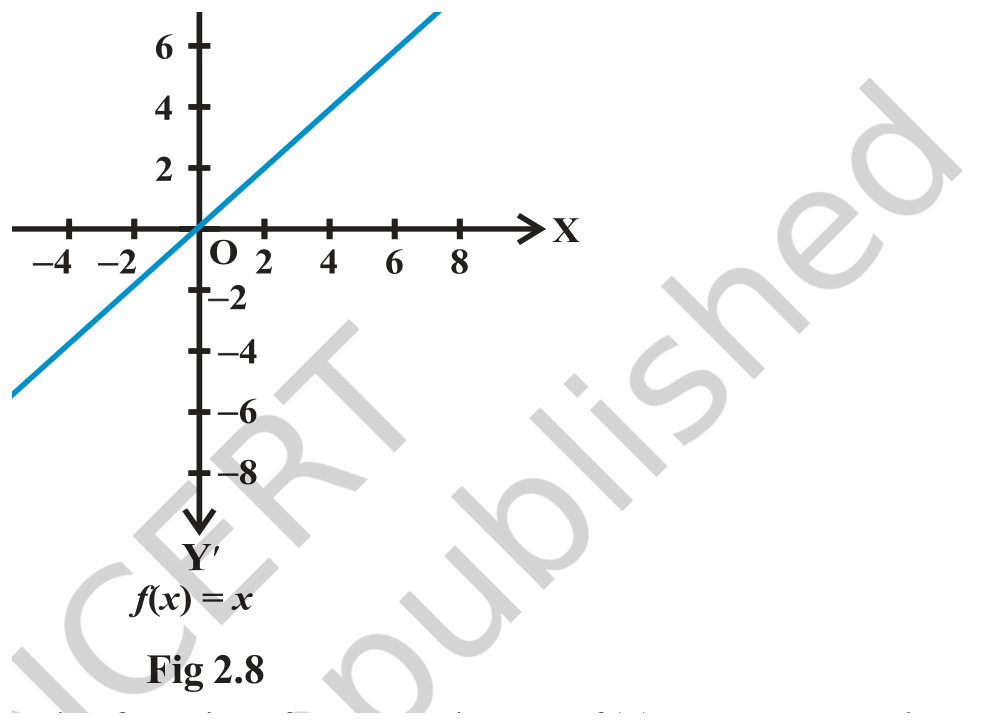
Graph of the identity function y = x as a straight line through the origin
3.4 Reading a graph for domain and range
Project the graph onto the axes. The domain is the set of x values hit by the graph, and the range is the set of y values. For the identity line, both projections cover every real number. For the parabola, every x is used and the y values start at 0 and rise on both sides. For the modulus graph, the domain is R and the range is the non-negative reals.
On the reciprocal graph, the vertical line x = 0 is a barrier and the horizontal line y = 0 is never reached. So the domain is R without 0 and the range is also R without 0. The signum graph uses every x but only three y values, so its range is the set {-1, 0, 1}.
The greatest integer graph deserves care. At each integer the value jumps by 1, and the left piece ends with the lower value while the right piece starts at the higher value. Reading the range as the set of integers follows from the definition at once.
3.5 Piecewise rules and the function test
Some functions are defined by different formulas on different parts of the domain. For example, a rule may say f(x) = x squared for x between 0 and 3, and f(x) = 3x for x between 3 and 10. Such a function still needs one image at every input. The formula for x = 3 must be settled so that the two pieces agree, or the definition must clearly assign 3 to one piece.
A piecewise relation fails the function test when the two branches give different values at the same input. If one branch gives f(3) = 9 and the other gives f(3) = 9, the input has one image and the relation is a function. If the branches disagree at 3, then 3 has two images and the relation is not a function.
3.6 Worked examples with values and tables
A function rule such as f(x) = 2x + 1 is evaluated by substitution. The values at 1, 2, 3, 4, 5 are 3, 5, 7, 9 and 11, and the table is often the first part of a graph question.
Tables in the other direction are also common. A table of Celsius and Fahrenheit values is generated by t(C) = 9C/5 + 32. Then t(0) = 32, t(28) = 82.4 and t(-10) = 14. When the temperature is given as 212 Fahrenheit, solve 9C/5 + 32 = 212 to get C = 100.
The domain of a formula with a fraction needs one extra step. For f(x) = (x squared + 2x + 1) / (x squared - 8x + 12), factor the denominator to (x - 2)(x - 6) and exclude x = 2 and x = 6. The domain is R minus {2, 6}. Always write the excluded values with the reason, because they come from a visible algebraic condition.
Exam
When a question asks for the domain and range of a formula, write the domain first, then compute the range over that domain. A range computed on the wrong domain earns no marks even when the algebra looks correct.