

Concepts: Growth, growth phases and growth rates
Plant Growth and Development24 min readLesson 1 of 7
1.1 What growth means in a plant
Growth is an increase in the size and mass of a living body. In a plant it happens by cell division and by cell enlargement, so the number of cells, the length, the area, the volume and the fresh or dry weight all rise. No single measure works for every part and every stage, which is why the chapter opens by warning that growth cannot be demonstrated with one parameter alone.
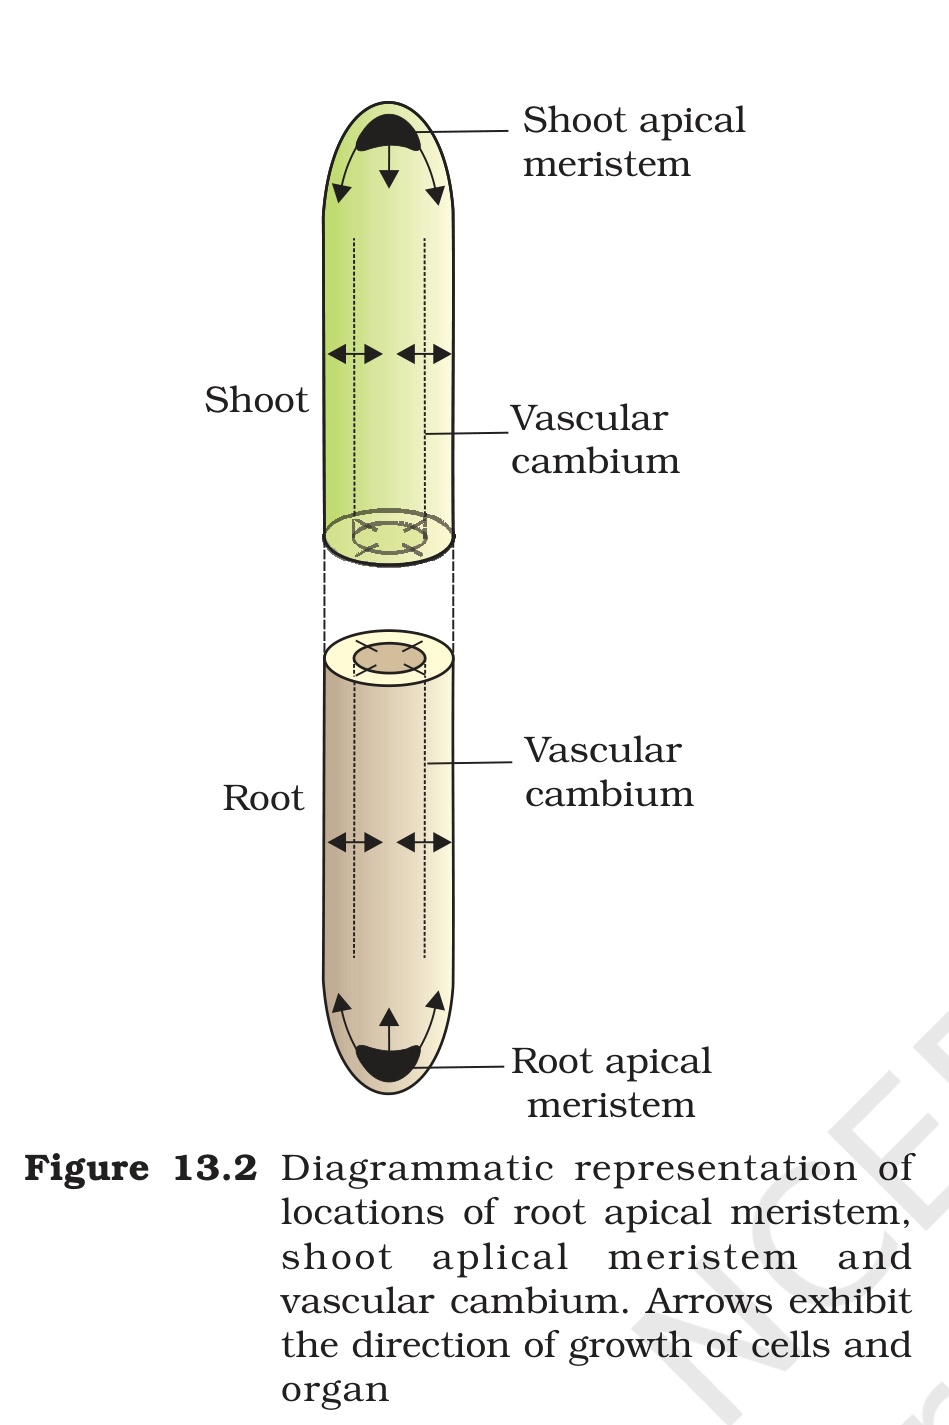
In an open system like a plant, growth continues in some regions through the whole life of the plant. Apical meristems at the shoot and root tips and the lateral cambium keep dividing, so new cells are added at these points even in an old tree. In an animal the growth stops after a fixed period, which is one of the clearest differences between the two kingdoms.
1.1.1 Three phases of growth in a root
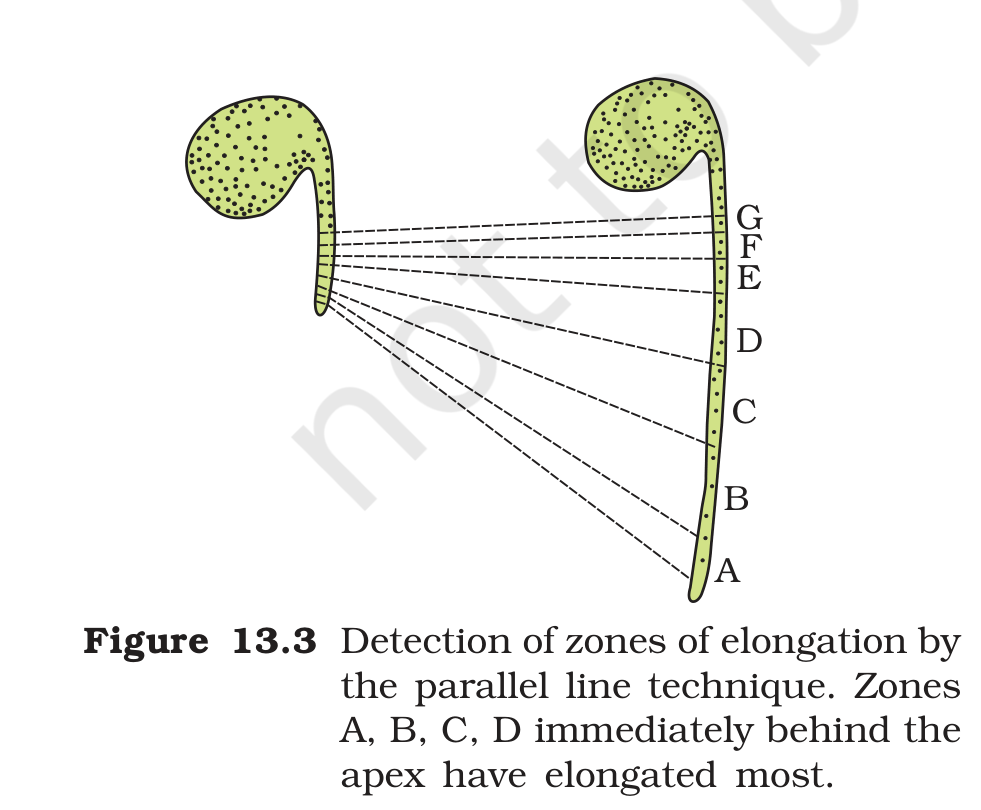
A growing root shows three zones in sequence. The meristematic zone is just behind the tip. Its cells divide continuously, have thin cellulosic walls, dense protoplasm and large prominent nuclei. The elongation zone lies further back: cells here enlarge in length by taking in water and developing a large vacuole. The maturation zone is behind the elongation zone, where cells finish enlarging and take on their final form and function. Figure 13.3 shows how the marks made by the parallel line technique shift as the zones move through the growing root.
1.1.2 Growth rates
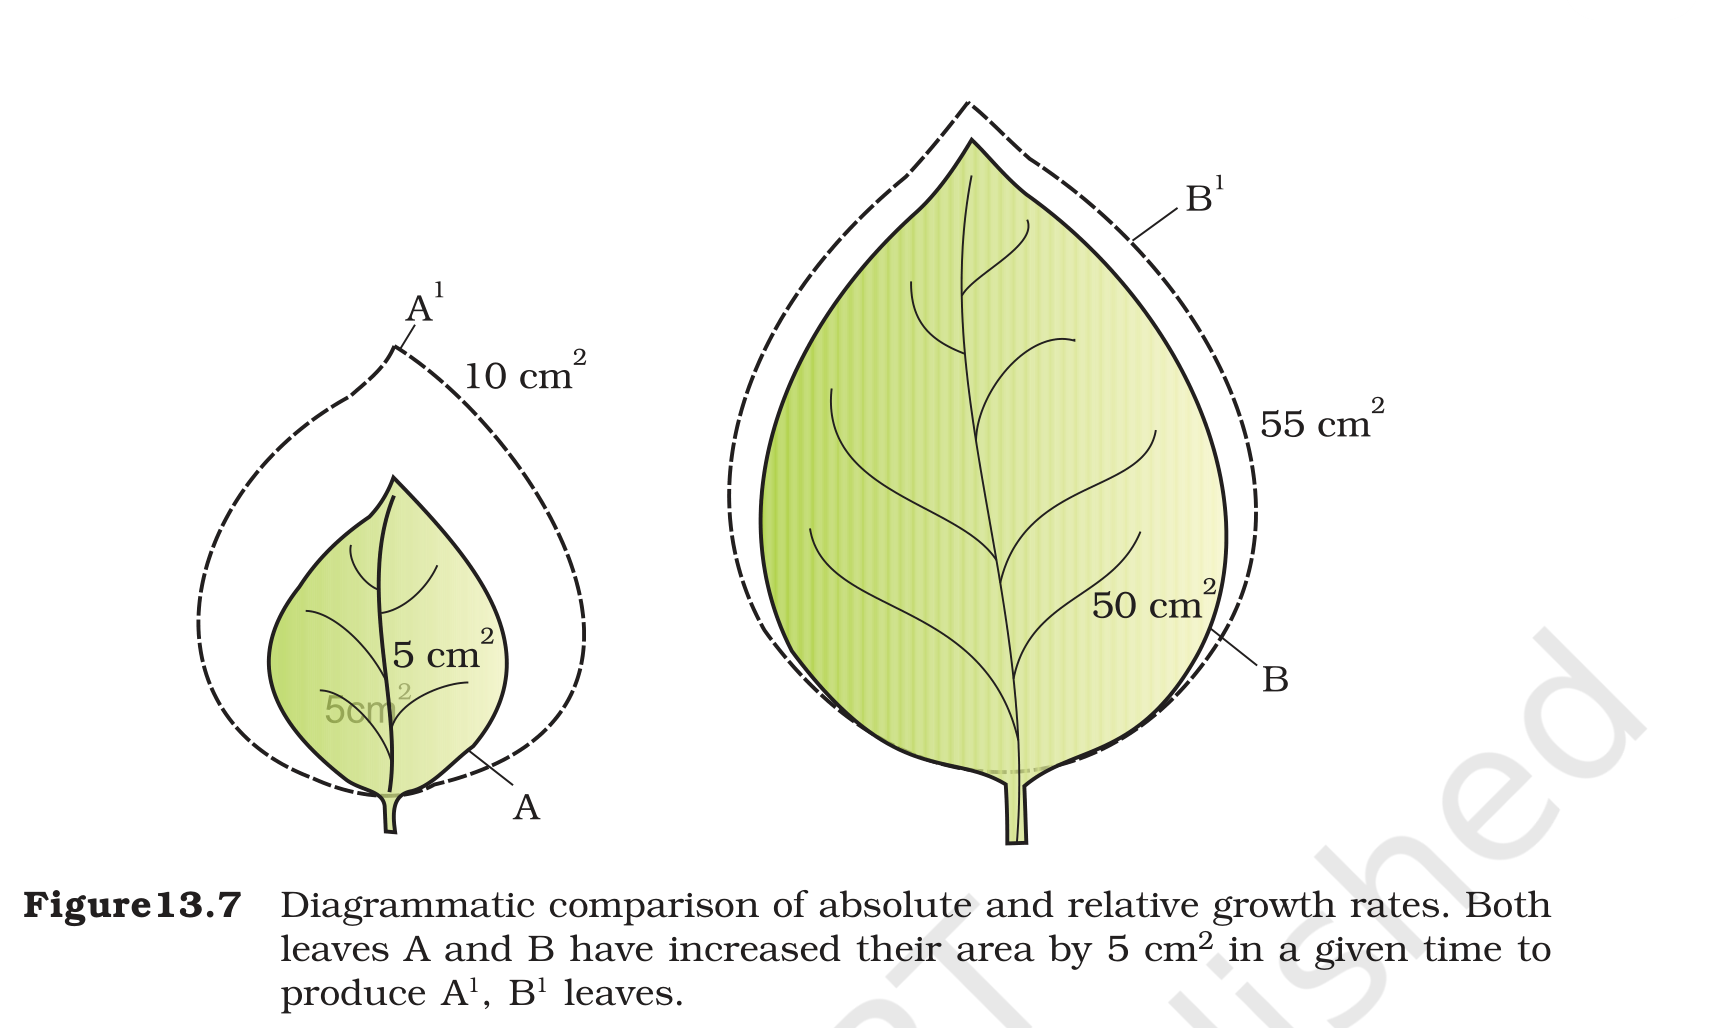
Growth can be measured as an absolute rate, which is the total increase per unit time, or as a relative rate, which is that increase divided by the original size. The relative growth rate is the better comparison between a small seedling and a large tree, because it says how fast each size of plant is adding to itself.
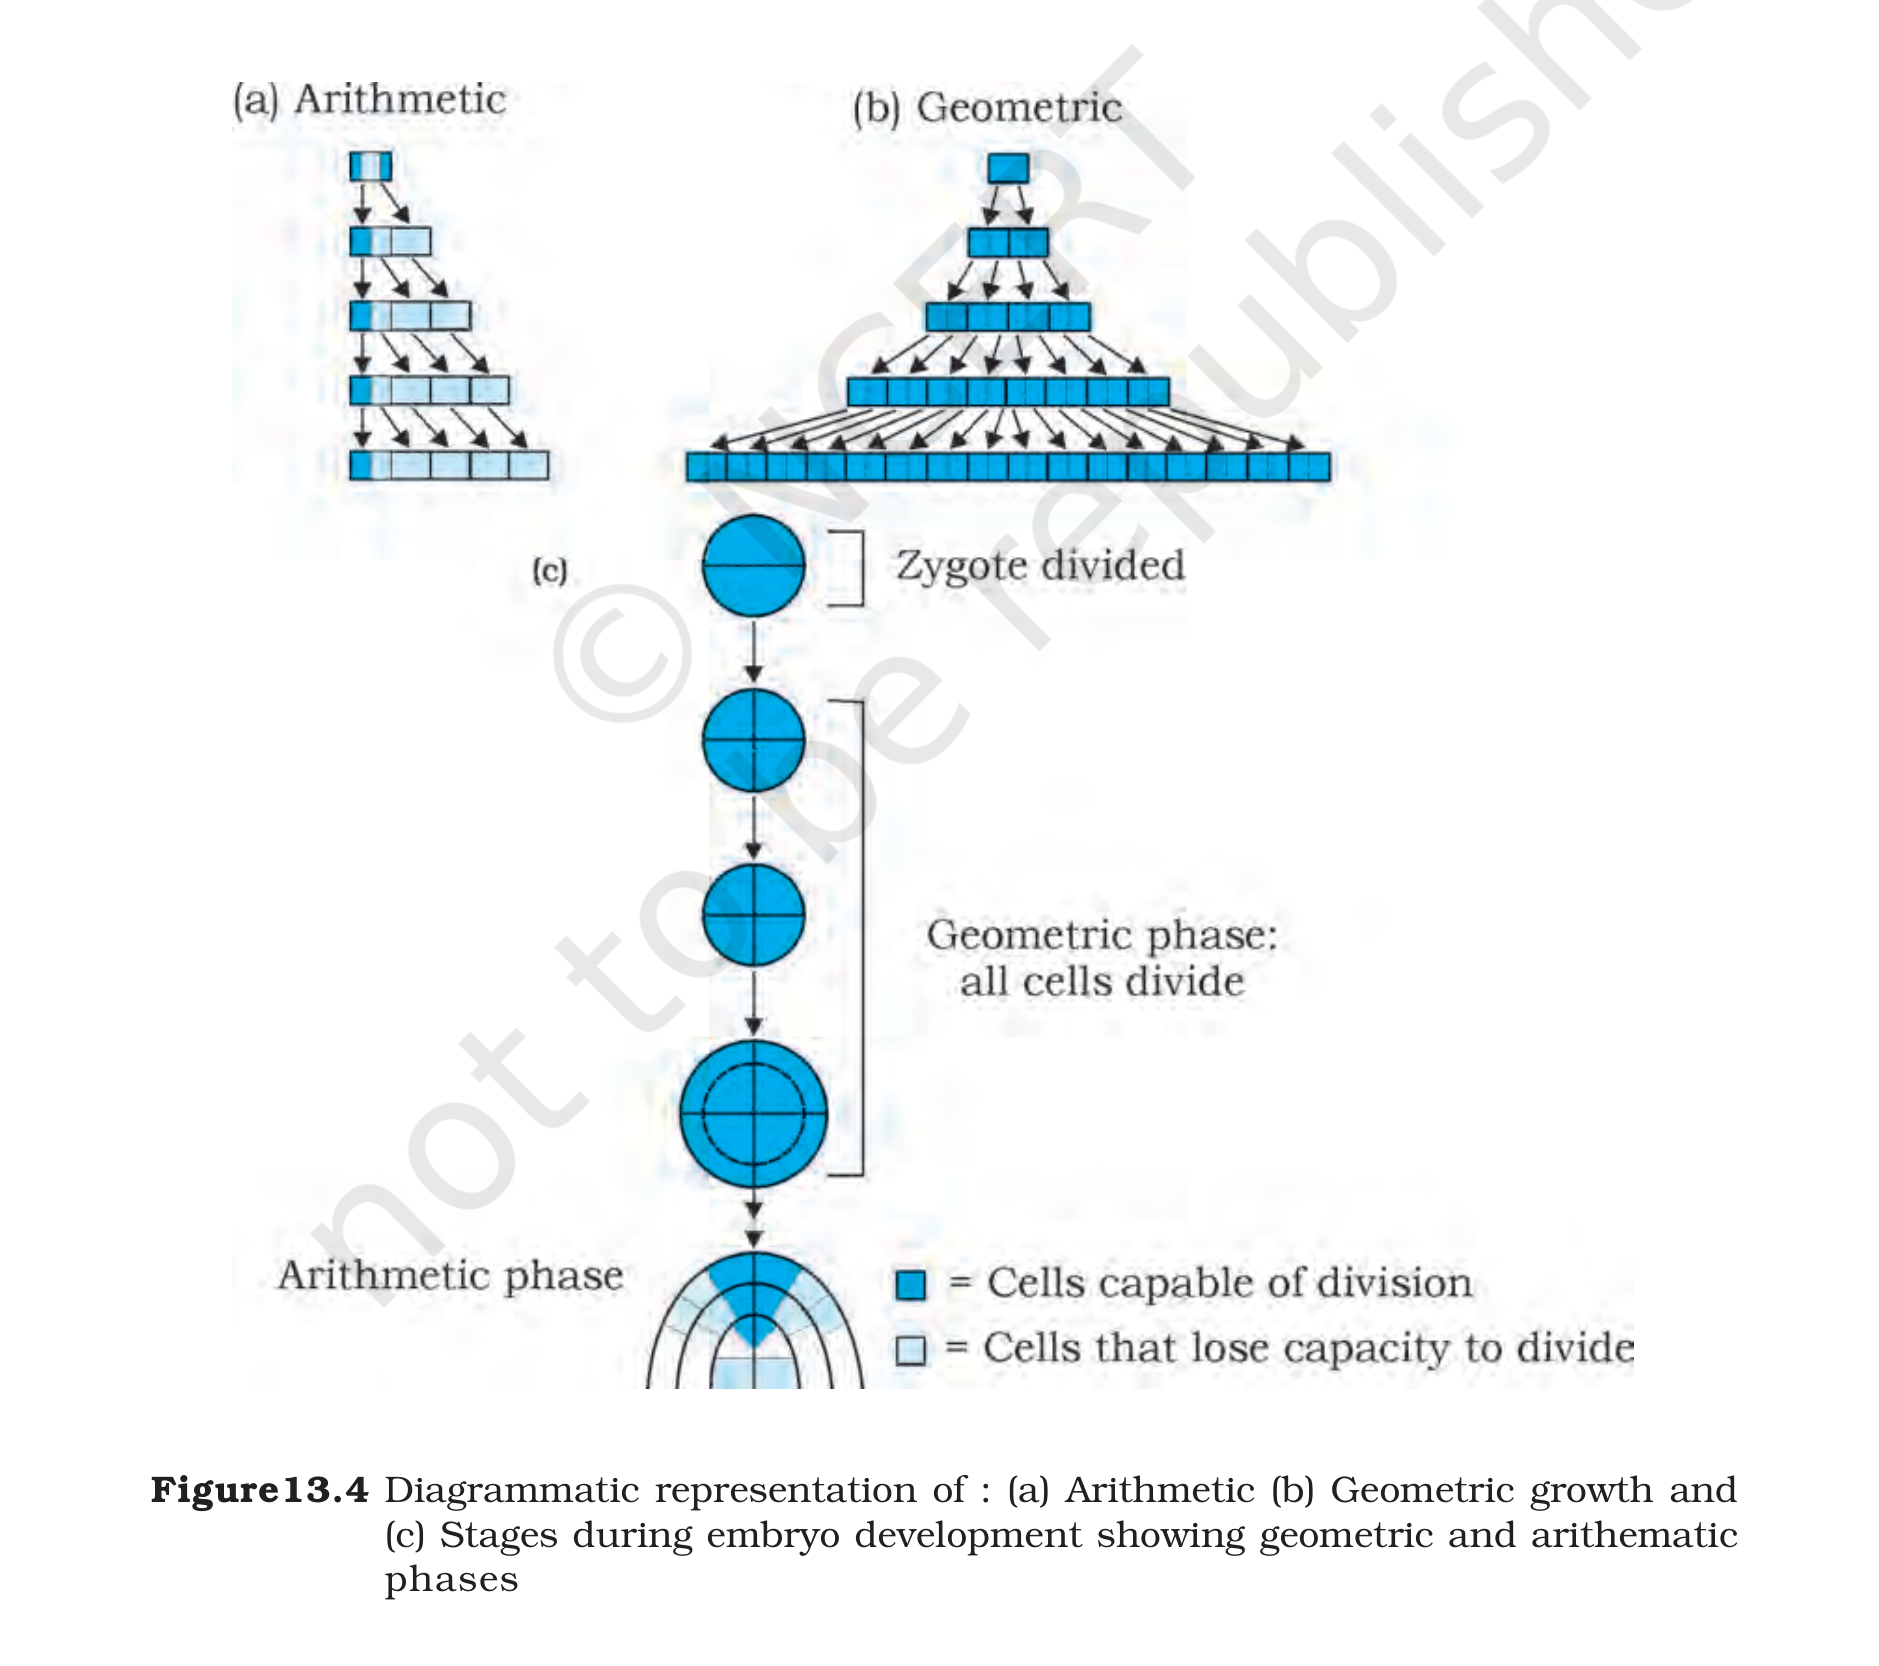
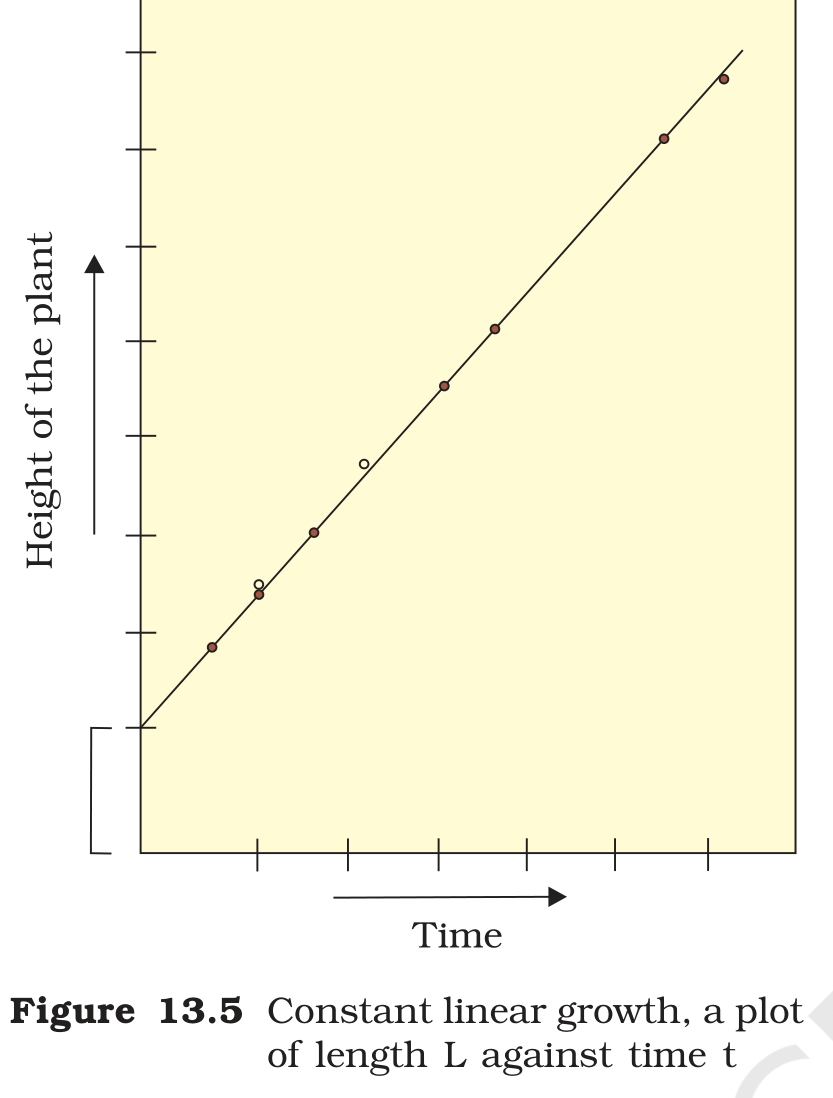
Arithmetic growth is the simpler pattern. One product of each mitotic division keeps dividing while the other differentiates, so the organ grows by a constant amount per unit time and the plot of length against time is a straight line. Figure 13.5 is such a plot, and it follows the relation L_t = L_0 + r t, where L_0 is the size at the start, r is the growth rate and t is the time. A root elongating at a steady rate is the standard example.
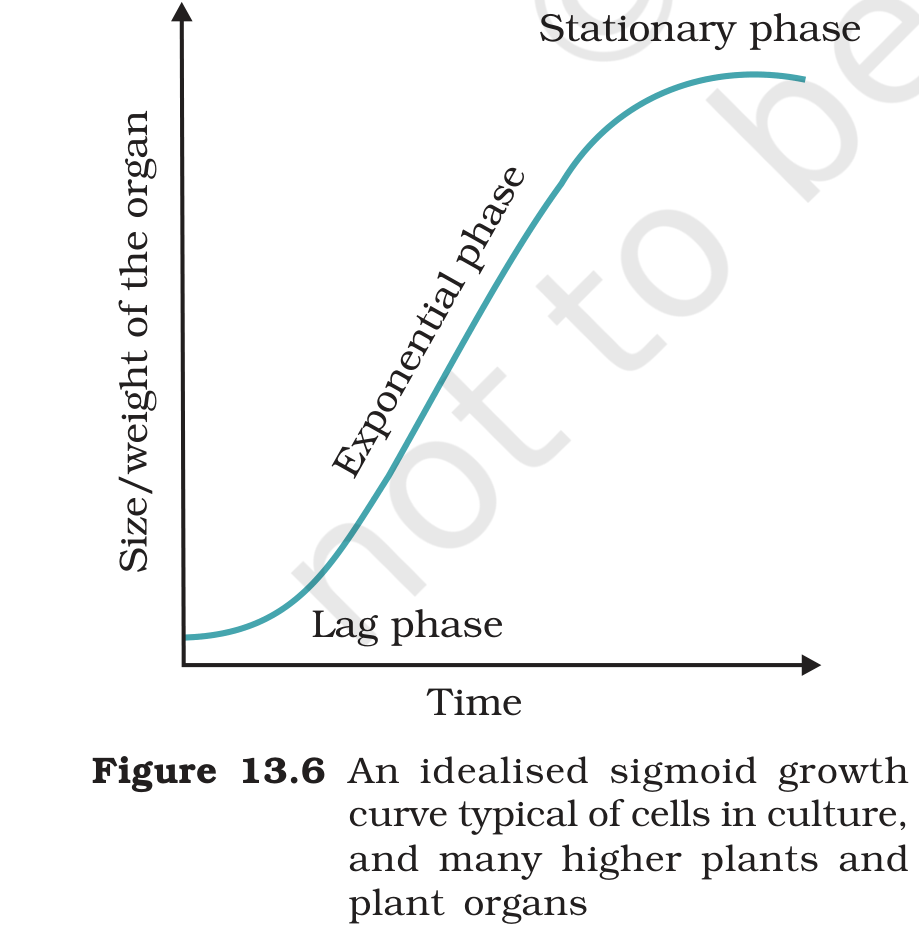
Geometric growth is the pattern in which both products of a division keep dividing, so the increase is proportionate to the size already reached and the curve rises faster and faster. The rise is described by W_1 = W_0 e raised to r t, where W_0 and W_1 are the initial and final sizes and r is the growth rate. The initial slow phase of geometric growth is the lag phase and the steep part is the exponential or log phase.
In a natural environment growth cannot stay exponential for long. Reserves run out, space and light become limiting and the rate settles, so the curve takes an S shape. This is the sigmoid or S curve of figure 13.6, with a lag phase, an exponential phase and a stationary phase. The sigmoid curve is the usual description of growth of whole plants and plant organs in the field.
1.1.3 How the phases connect to the graph
The three zones of the root are not isolated stages. A cell formed in the meristematic zone moves into the elongation zone as newer cells push it back, and it reaches the maturation zone after it has finished enlarging. The parallel line technique of figure 13.3 makes the movement visible: marks made on the root surface move apart as the cells between them elongate, which tells the observer where the elongation zone lies at the moment of the measurement. In the same way the sigmoid curve of figure 13.6 is the summary of many cells passing through these zones in a coordinated way. Early in the life of the organ most cells are in the division and elongation stages, so the rise is slow at first, then fast; later the proportion of mature cells grows, the number of dividing cells falls and the curve levels into the stationary phase.
1.1.4 Practice from the NCERT exercises, questions 2, 3 and 11
Exercise 2. No single parameter shows growth through the whole life of a flowering plant because the plant grows in different ways at different stages. Early growth is mainly cell division, later growth is cell enlargement, and at the reproductive stage dry mass may rise while length stops changing. Only a set of measures such as cell number, length, area and dry weight, taken together, describes growth over the whole life.
Exercise 3. Arithmetic growth adds a constant amount per unit time and gives a straight line. Geometric growth multiplies the existing size at each step and gives an exponential curve. The sigmoid curve combines both and adds a stationary phase. Absolute growth rate is the total increase per unit time, while relative growth rate is the increase per unit time per unit of initial size.
Exercise 11. In the sigmoid curve the first part is the lag phase, the steep middle part is the exponential or log phase and the flat upper part is the stationary phase.
Exam
For a growth rate question, write the formula first. Arithmetic growth uses L_t = L_0 + r t, geometric growth uses W_1 = W_0 e raised to r t, and relative growth rate is the increase divided by the original size. When a graph is given, name the three parts of the sigmoid curve in order before explaining any of them.
Common mistake
Do not say that growth is always measured by length. A plant may grow wider without growing taller, and dry weight can rise after length has stopped changing. Do not confuse absolute and relative growth rates: the absolute rate is the total increase per unit time while the relative rate divides that increase by the starting size. Also do not draw a sigmoid curve as a straight line; the straight line belongs to arithmetic growth.