

Concepts: Patterns of biodiversity
Biodiversity and Conservation17 min readLesson 2 of 6
2.1 Diversity is not evenly spread
Species diversity is not uniform across the world. The best-known pattern is the latitudinal gradient: diversity generally falls as one moves from the equator towards the poles. The tropics, between about 23.5 degrees north and south, hold more species than temperate or polar regions, with very few exceptions.
The numbers make the point. Colombia, near the equator, has nearly 1,400 bird species. New York at 41 degrees north has 105 species, and Greenland at 71 degrees north has just 56. India, with much of its land in tropical latitudes, has more than 1,200 bird species. A tropical forest in Ecuador can hold up to ten times as many vascular plants as a temperate forest of the same area in the American Midwest. The Amazonian rain forest, largely tropical, is the richest place on earth: more than 40,000 plant species, 3,000 fishes, 1,300 birds, 427 mammals, 427 amphibians, 378 reptiles and over 1,25,000 invertebrates, with at least two million insect species still to be named.
2.2 Why the tropics are richer
Three explanations are offered. The first is evolutionary time: speciation takes time, and tropical latitudes have stayed relatively undisturbed for millions of years, while temperate regions repeatedly suffered glaciation, so the tropics had longer to build diversity. The second is environmental stability: tropical climates are less seasonal and more predictable, and a constant environment favours niche specialisation, which produces more species. The third is energy: more solar energy falls in the tropics, which supports higher productivity and, indirectly, greater diversity.
2.3 The species-area relationship
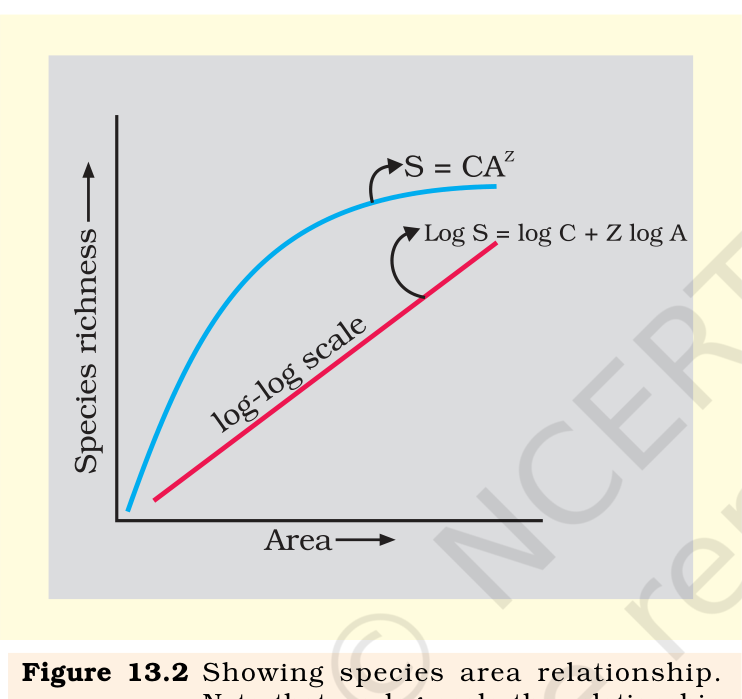
The naturalist Alexander von Humboldt observed during his South American travels that within a region, species richness increases with the area explored, but only up to a limit. For many groups, such as angiosperms, birds, bats and freshwater fishes, the curve of species richness against area is a rectangular hyperbola. Plotted on a log scale the same relationship is a straight line: logS = logC + Z logA. Here S is species richness, A is area, C the Y intercept and Z the slope.
Ecologists find that Z usually lies between 0.1 and 0.2, whatever the group or region; the slopes for British plants, Californian birds and New York molluscs are remarkably similar. The slope becomes much steeper when very large areas such as whole continents are compared, where Z ranges from 0.6 to 1.2. Frugivorous birds and mammals in tropical forests of different continents give a slope of 1.15. A steeper slope means that species richness rises faster with area, so larger areas hold disproportionately more species, which is why habitat destruction has such a heavy cost.
2.4 Why slopes matter in conservation
The species-area relationship is not a curiosity. It predicts how many species a reserve can hold, and therefore how much diversity is lost when a habitat is reduced. If a forest is cut to a tenth of its area, the equation suggests that a large share of its species will eventually disappear, even if the remaining patch looks healthy at first. That is the reasoning behind setting aside large, connected protected areas rather than many small isolated ones.
2.5 Reading the graph
On an ordinary scale, species richness rises steeply with area and then flattens, because a larger area adds new species quickly at first and then more slowly. The flattening is why the curve is a rectangular hyperbola rather than a straight line. On a log scale the same data become a straight line, which is what makes the slope Z so useful: a single number summarises how strongly richness responds to area for that group.
2.6 Two patterns, one message
Both patterns say the same thing in different ways. The latitudinal gradient says that conditions and history decide how many species a place can hold. The species-area relationship says that size decides the same question, and that smaller remnants hold fewer species than their parent habitat. Put together, they explain why a tropical forest that is cut into small pieces loses more than its trees: it loses the conditions and the space that produced its diversity in the first place. That is the practical lesson of both patterns, and the reason a single large reserve usually holds more species than several small patches covering the same total area.
Exam
Latitudinal gradient answers need the examples, not just the statement. Learn Colombia, New York and Greenland for birds, and the Amazon figures for the richest forest. For the species-area relationship, write the equation, define each symbol, and state that Z lies between 0.1 and 0.2 within regions and between 0.6 and 1.2 across continents. A common mistake is to give Z as a fixed number without saying which case it belongs to.