
Concepts: Population attributes and density
Organisms and Populations17 min readLesson 1 of 6
1.1 Ecology at the population level
Ecology studies how organisms relate to one another and to the physical surroundings. It works at four levels: the organism, the population, the community and the biome. This chapter sits at the second level.
Individuals of a species rarely live alone. Most live in groups inside a bounded geographical area, share or compete for the same resources, and can interbreed, which is what makes a population. Interbreeding suggests sexual reproduction, yet ecologists also treat a group produced asexually as a population. A wetland's cormorants, rats in a deserted house, teak trees in one stretch of forest, bacteria on a plate and lotus in a pond each count as a population.
An individual faces a changing environment alone, but natural selection works on the population, because that is where heritable variation sits. Population ecology therefore connects ecology with population genetics and evolution.
1.2 Attributes that only a population has
A population has features an individual lacks. A single organism is born and dies, but a population has a birth rate and a death rate, and both are per-capita figures. They express the change in numbers relative to the number of members present.
Suppose a pond held 20 lotus plants last year and reproduction added 8, taking the count to 28. The birth rate is 8 divided by 20, or 0.4 offspring per lotus per year. If 4 out of 40 fruitflies in a laboratory culture died in a week, the death rate for that week is 4 divided by 40, or 0.1 per fruitfly per week.
A population also has a sex ratio, for instance 60 per cent females against 40 per cent males, a property no single organism holds.
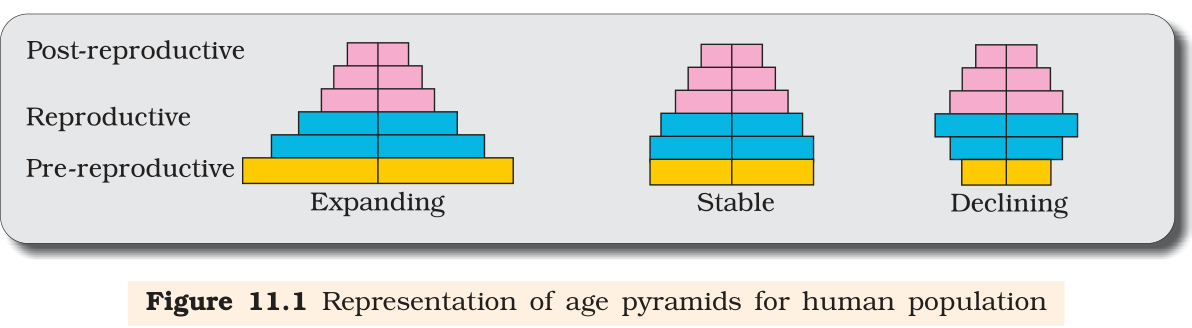
A population at any moment also contains individuals of different ages. The age distribution is the share of individuals in each age group, and plotting it gives an age pyramid (Figure 11.1). In human populations the pyramid usually separates males and females. Its shape tells you whether the population is growing, stable or declining: a broad base with a narrow top means many young people and a growing population, a barrel shape means a stable one, and a narrow base means fewer young people and a declining population.
1.3 Measuring population size
Population size, or population density, is written N, and it is the measure used to judge the state of a population. Whenever a factor is said to affect a population, the effect is read as a change in N. In nature N can be under ten, as with the Siberian cranes at Bharatpur wetlands in some years, or it can run into millions, as with Chlamydomonas in a pond.
Counting every individual is not always sensible. If an area holds 200 Parthenium plants and a single banyan tree with a huge canopy, reporting the banyan's density as low compared with Parthenium would badly understate the banyan's role in that community. For such cases, per cent cover or biomass is a better measure. Total number also fails when a population is enormous or counting is too slow, as with a dense bacterial culture in a petri dish.
Sometimes only a relative measure is needed. The number of fish caught per trap serves as a good index of the fish population in a lake. Often the size has to be estimated without counting or even seeing the animals. The tiger census in national parks is based on pug marks and faecal pellets, not on sighting every tiger. Estimating rather than counting is not a weakness here; it is the only workable choice in a large forest. Age structure is the other attribute worth reading carefully in applied work. A conservation programme that protects only adults in a species with a narrow base is protecting the wrong part of the population, because the next generation is already too small. The same reading applies to human populations, where a wide base means pressure on schools and jobs two decades later. The same logic explains why a fishery uses catch per trap and why a plant ecologist uses per cent cover in a grassland where individual stems cannot be told apart. Each measure answers a different question, and the right choice depends on what the study needs to know.