
Concepts: Hydrogen spectra, de Broglie waves and limitations
Atoms19 min readLesson 4 of 6
4.1 Line spectra
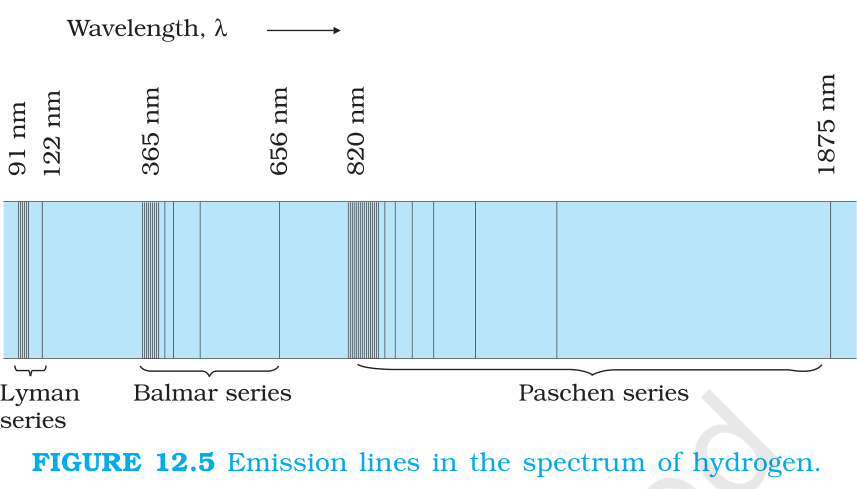
Each element has a characteristic spectrum. When a gas at low pressure is excited by an electric current, the light it emits contains only certain wavelengths, and the spectrum appears as bright lines on a dark background. This is an emission line spectrum, and the spectrum of atomic hydrogen is the standard example (Figure 12.5). The pattern acts as a fingerprint for the gas.
When white light passes through the gas and the transmitted light is analysed, dark lines appear at exactly the wavelengths the gas emits. This is the absorption spectrum. The dark lines mark the frequencies the gas has taken out of the white light.
4.2 The hydrogen series
Bohr's third postulate explains all of this. When the electron falls from a state with quantum number n i to a lower state n f, the photon carries the energy difference, so hν = E ni - E nf. Substituting the energy formula gives the Rydberg expression for the wavelength:
1/λ = R (1/n f squared - 1/n i squared)
where R is the Rydberg constant, about 1.097 × 10 to the 7 per metre.
The series is named by the lower level of the transition. Lyman has n f = 1; its lines fall in the ultraviolet. Balmer has n f = 2 and its first lines are in the visible range; this is the series seen in the laboratory. Paschen has n f = 3, Brackett n f = 4 and Pfund n f = 5, and all of these lie in the infrared. The first line of a series comes from the nearest higher level, so the first Lyman line is the n = 2 to n = 1 transition and the second Lyman line is n = 3 to n = 1. The wavelength series converges to a limit as n i becomes large, because the levels crowd together.
4.3 de Broglie's explanation
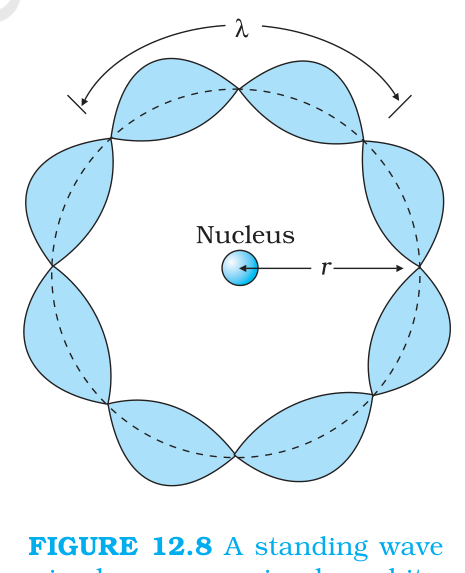
The most puzzling part of Bohr's model was the second postulate: why should angular momentum come only in whole multiples of h/2π? De Broglie answered this in 1923 by treating the orbiting electron as a wave. A wave travelling round a circular orbit must match itself after one circuit, exactly as a standing wave on a string has nodes at the fixed ends. Only certain wavelengths fit: the circumference must contain a whole number of wavelengths.
Write this condition as 2π r n = n λ, with λ the de Broglie wavelength h/(m v). Substituting gives 2π r n = n h/(m v n), which rearranges to m v n r n = n h/2π. That is exactly Bohr's quantisation condition. The allowed orbits are the circular standing waves, and only these survive; other wavelengths interfere with themselves and cannot persist (Figure 12.8). This was a striking success for the wave-particle duality idea.
4.4 Limits of the Bohr model
Bohr's model works for hydrogenic atoms, meaning systems with one electron and a nucleus of charge +Ze, such as hydrogen, singly ionised helium and doubly ionised lithium. It cannot be extended even to helium, which has two electrons. The reason is that each electron in a multi-electron atom feels the pull of the nucleus and the push of every other electron as well, while Bohr's formulation includes only the nucleus-electron force.
The model also cannot explain the relative intensities of spectral lines. Some transitions are favoured and some are rare, which is why some lines are bright and others faint; Bohr's model gives the frequencies but not the brightness. A fuller picture came only with quantum mechanics, which replaced definite orbits with regions where the electron is likely to be found.
4.5 A worked spectral calculation
Take the first Balmer line as a model for every such calculation. The transition is n i = 3 to n f = 2. The Rydberg expression gives 1/λ = R(1/4 - 1/9) = 5R/36. With R = 1.097 × 10 to the 7 per metre, λ = 36/(5 × 1.097 × 10 to the 7), which is 6.56 × 10 to the -7 m, or 656 nm. The quick alternative is the photon-energy route: E3 - E2 = -1.51 - (-3.40) = 1.89 eV, and λ = 1240/1.89 = 656 nm. Both routes agree, and either is acceptable in the exam if the steps are shown.
The series also tell you what the eye can and cannot see. Only the first few Balmer lines fall in the visible range; the rest of that series and every line of the other series lie outside it. That is why the hydrogen spectrum in a discharge tube shows four bright lines in the visible region, while a detector sensitive to the ultraviolet or infrared picks up many more.