

Exercise practice 1: Tales by Dots and Lines
Tales by Dots and Lines24 min readLesson 3 of 7
3.1 Figure it Out: means, medians and dot plots
3.1.1 FIO 1, Q1: means of three lists
(i) The first 50 natural numbers are 1 to 50. Their sum is 50 × 51 ÷ 2 = 1275, so the mean is 1275 ÷ 50 = 25.5. (ii) The first 50 odd numbers are 1, 3, …, 99. Their sum is 50² = 2500, so the mean is 2500 ÷ 50 = 50. (iii) The first 50 multiples of 4 have sum 4 × (1 + 2 + … + 50) = 4 × 1275 = 5100, so the mean is 5100 ÷ 50 = 102.
Observation: the mean of the first n odd numbers is n; the mean of the first n natural numbers is (n + 1)/2; and multiplying every value by 4 multiplies the mean by 4.
3.1.2 FIO 1, Q2: the missing dot
Reading the dot plot gives ten dots: one at 4, one at 7, two at 8, five at 9 and one at 11. Their sum is 4 + 7 + 16 + 45 + 11 = 83. If the missing value is v, the mean of the 11 dots must be 9, so (83 + v) ÷ 11 = 9. Hence 83 + v = 99 and v = 16. The missing dot belongs at 16.
3.1.3 FIO 1, Q3: the shoe allowance
The class has 24 students and the mean height with shoes is 150.2 cm. Shoes add 1 cm to every student's height, so every value in the data is 1 cm too large. Subtracting 1 from every value lowers the mean by exactly 1, giving 149.2 cm. The teacher does not need to measure anyone again; reusing the existing data is enough. The correct option is (d).
3.1.4 FIO 1, Q4: which album has mean 5.57 minutes?
Album A's dots are at 5, 5, 5.25, 5.5, 5.75, 6 and 6.5 minutes. The sum is 39 and there are 7 songs, so the mean is 39 ÷ 7 = 5.571… ≈ 5.57 minutes. Album A is the answer. The other two dot plots have different totals and different counts, so their means are not 5.57; reading each dot as one value, adding and dividing is the method.
3.1.5 FIO 1, Q5: the median and three experiments
After sorting, the lower half ends at 41 and the upper half begins at 41 as well. There are 16 values, so the median is the average of the 8th and 9th values, both 41, which gives 41.
(i) Adding one value leaves 17 values with median at position 9. Because the two middle values are both 41, any single added value keeps the median at 41; for example, adding 100 gives position 9 as 41. (ii) Adding two values leaves 18 values and the median is the average of positions 9 and 10. Both must be 41. Adding one value below 41 and one above, such as 10 and 100, keeps those two positions at 41, so the median stays 41. (iii) Removing one value leaves 15 values with median at position 8. Removing any single value still leaves a 41 at that position, so the median stays 41; examples are removing 8 or removing 100.
3.1.6 FIO 1, Q6: always, sometimes or never true
(i) Taking away a value that is below the median will pull the median down. False in general: removing a small value can leave the median unchanged or even raise it. For example, the median of 1, 2, 3, 4, 5 is 3; removing 1 gives 2, 3, 4, 5 with median 3.5, which is larger. So the statement is never true. (ii) Putting in a value below the mean will pull the mean down. Always true: the new total is smaller than it would be for a value equal to the mean, so the new mean is below the old one. (iii) Putting in any four values will leave the median unchanged. Sometimes true: adding four values far on both sides of the middle may leave the median where it was, but other four values change it. (iv) Putting in four values below the median will push the median up. Never true: adding values on the low side shifts the middle positions down, so the median cannot increase.
3.1.7 FIO 1, Q7: find y
The number of values is 8 and the mean is 10.375, so the total is 8 × 10.375 = 83. The seven known numbers add to 8 + 13 + 10 + 4 + 5 + 20 + 10 = 70. Hence y = 83 − 70 = 13.
3.1.8 FIO 1, Q8: total from mean
The mean is 134 over 15 values, so the sum is 134 × 15 = 2010.
3.1.9 FIO 1, Q9: possible values of p
With 11 values the median is the 6th value in order. The listed values are 8, 8, 12, 18, 25, 29, 35, 39, 47, 73. For the 6th value to be 29, there must be exactly five values below 29. The ten listed values contain five below 29 (8, 8, 12, 18, 25), so p must be 29 or larger. The possible options are 29, 30, 40, 47 and 100; 10 and 25 fail.
3.1.10 FIO 1, Q10: the cycle dot plot
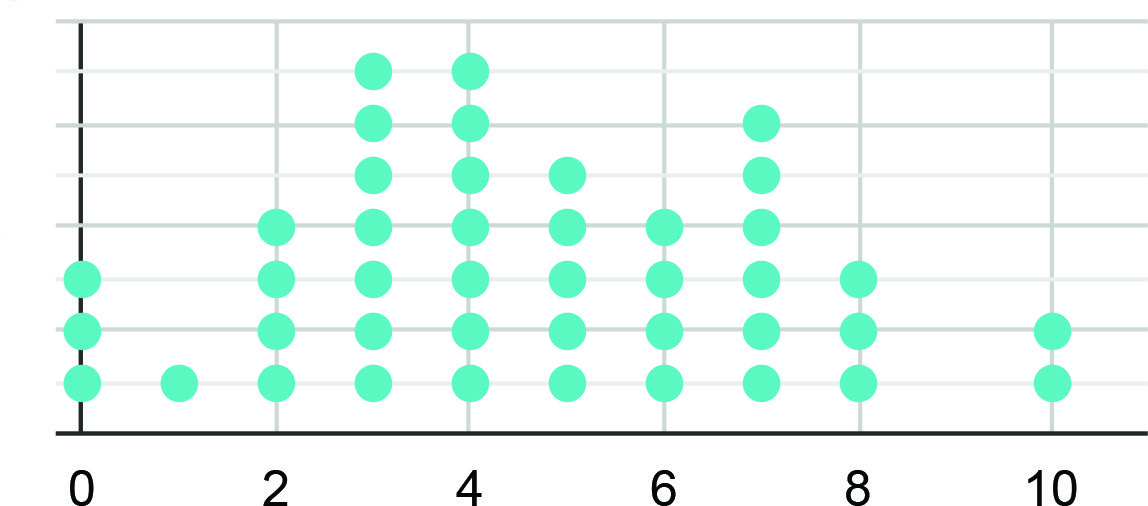
Counting the dots by value: 0 appears 3 times, 1 once, 2 four times, 3 seven times, 4 seven times, 5 five times, 6 four times, 7 six times, 8 three times and 10 twice. That is 42 students and a total of 193 rides, so the mean is 193 ÷ 42 ≈ 4.6. The 21st and 22nd values both fall at 4, so the median is 4.
Validity of the statements: (a) false, because three students never used the cycle; (b) valid, because 39 of the 42 used it at least once and most used it several times; (c) valid if read as "more than once in the week", since many values are above 1, though the plot does not track individual days; (d) false, because 38 students rode more than once in the week, not 5. (e) If everyone rides one more time next week, the mean rises by 1 to about 5.6 and the median rises by 1 to 5.
3.1.11 FIO 1, Q11: the dart competition
The ten table rows give the student counts. Trial 1 has one student, trials 2 and 3 have none, then the counts are 1, 4, 9, 12, 15 and ten each for the last two trials. The number of students is 62 and the total number of throws is 1×1 + 4×1 + 5×4 + 6×9 + 7×12 + 8×15 + 9×10 + 10×10 = 473. So the mean is 473 ÷ 62 ≈ 7.63 throws. The minimum is 1 and the maximum is 10. The median is the average of the 31st and 32nd values; the cumulative counts reach 27 at 7 throws and 42 at 8 throws, so both middle values are 8 and the median is 8.
3.2 Figure it Out: two line-graph tasks
3.2.1 FIO 2, Q1: customers visiting and purchasing
Statement: the table records two weekly averages for a shop, one for people who came in and one for people who bought something. Draw a line graph.
Method: put the days Monday to Sunday on the horizontal axis and the number of customers on the vertical axis, with a scale from 0 to 40 in steps of 5. Plot the visiting values 16, 19, 10, 14, 20, 22, 35 and join them with a line; plot the purchasing values 10, 8, 7, 11, 12, 16, 26 as a second line with a different marker. Label both lines and key them with a legend.
Observations: both lines peak on Sunday, when 35 people visited and 26 purchased; the visiting line is always above the purchasing line; the gap is smallest on Wednesday (10 visiting, 7 purchasing, gap 3) and largest on Sunday (gap 9). Monday to Thursday are quieter than the weekend.
3.2.2 FIO 2, Q2: rainfall in four cities
(i) The data is a monthly average over several years. Weather stations record daily rainfall; for each month the totals over many years are added and divided by the number of years. The result is the average number of rainy days in that month.
(ii) To plot Mangaluru, Port Blair and Rameswaram, mark each month's value on the graph (rounded to the nearest integer) and join the points for each city with a line and its own marker. Mangaluru's values rise sharply from May and peak in July; Port Blair stays high through the monsoon months; Rameswaram has a smaller peak late in the year.
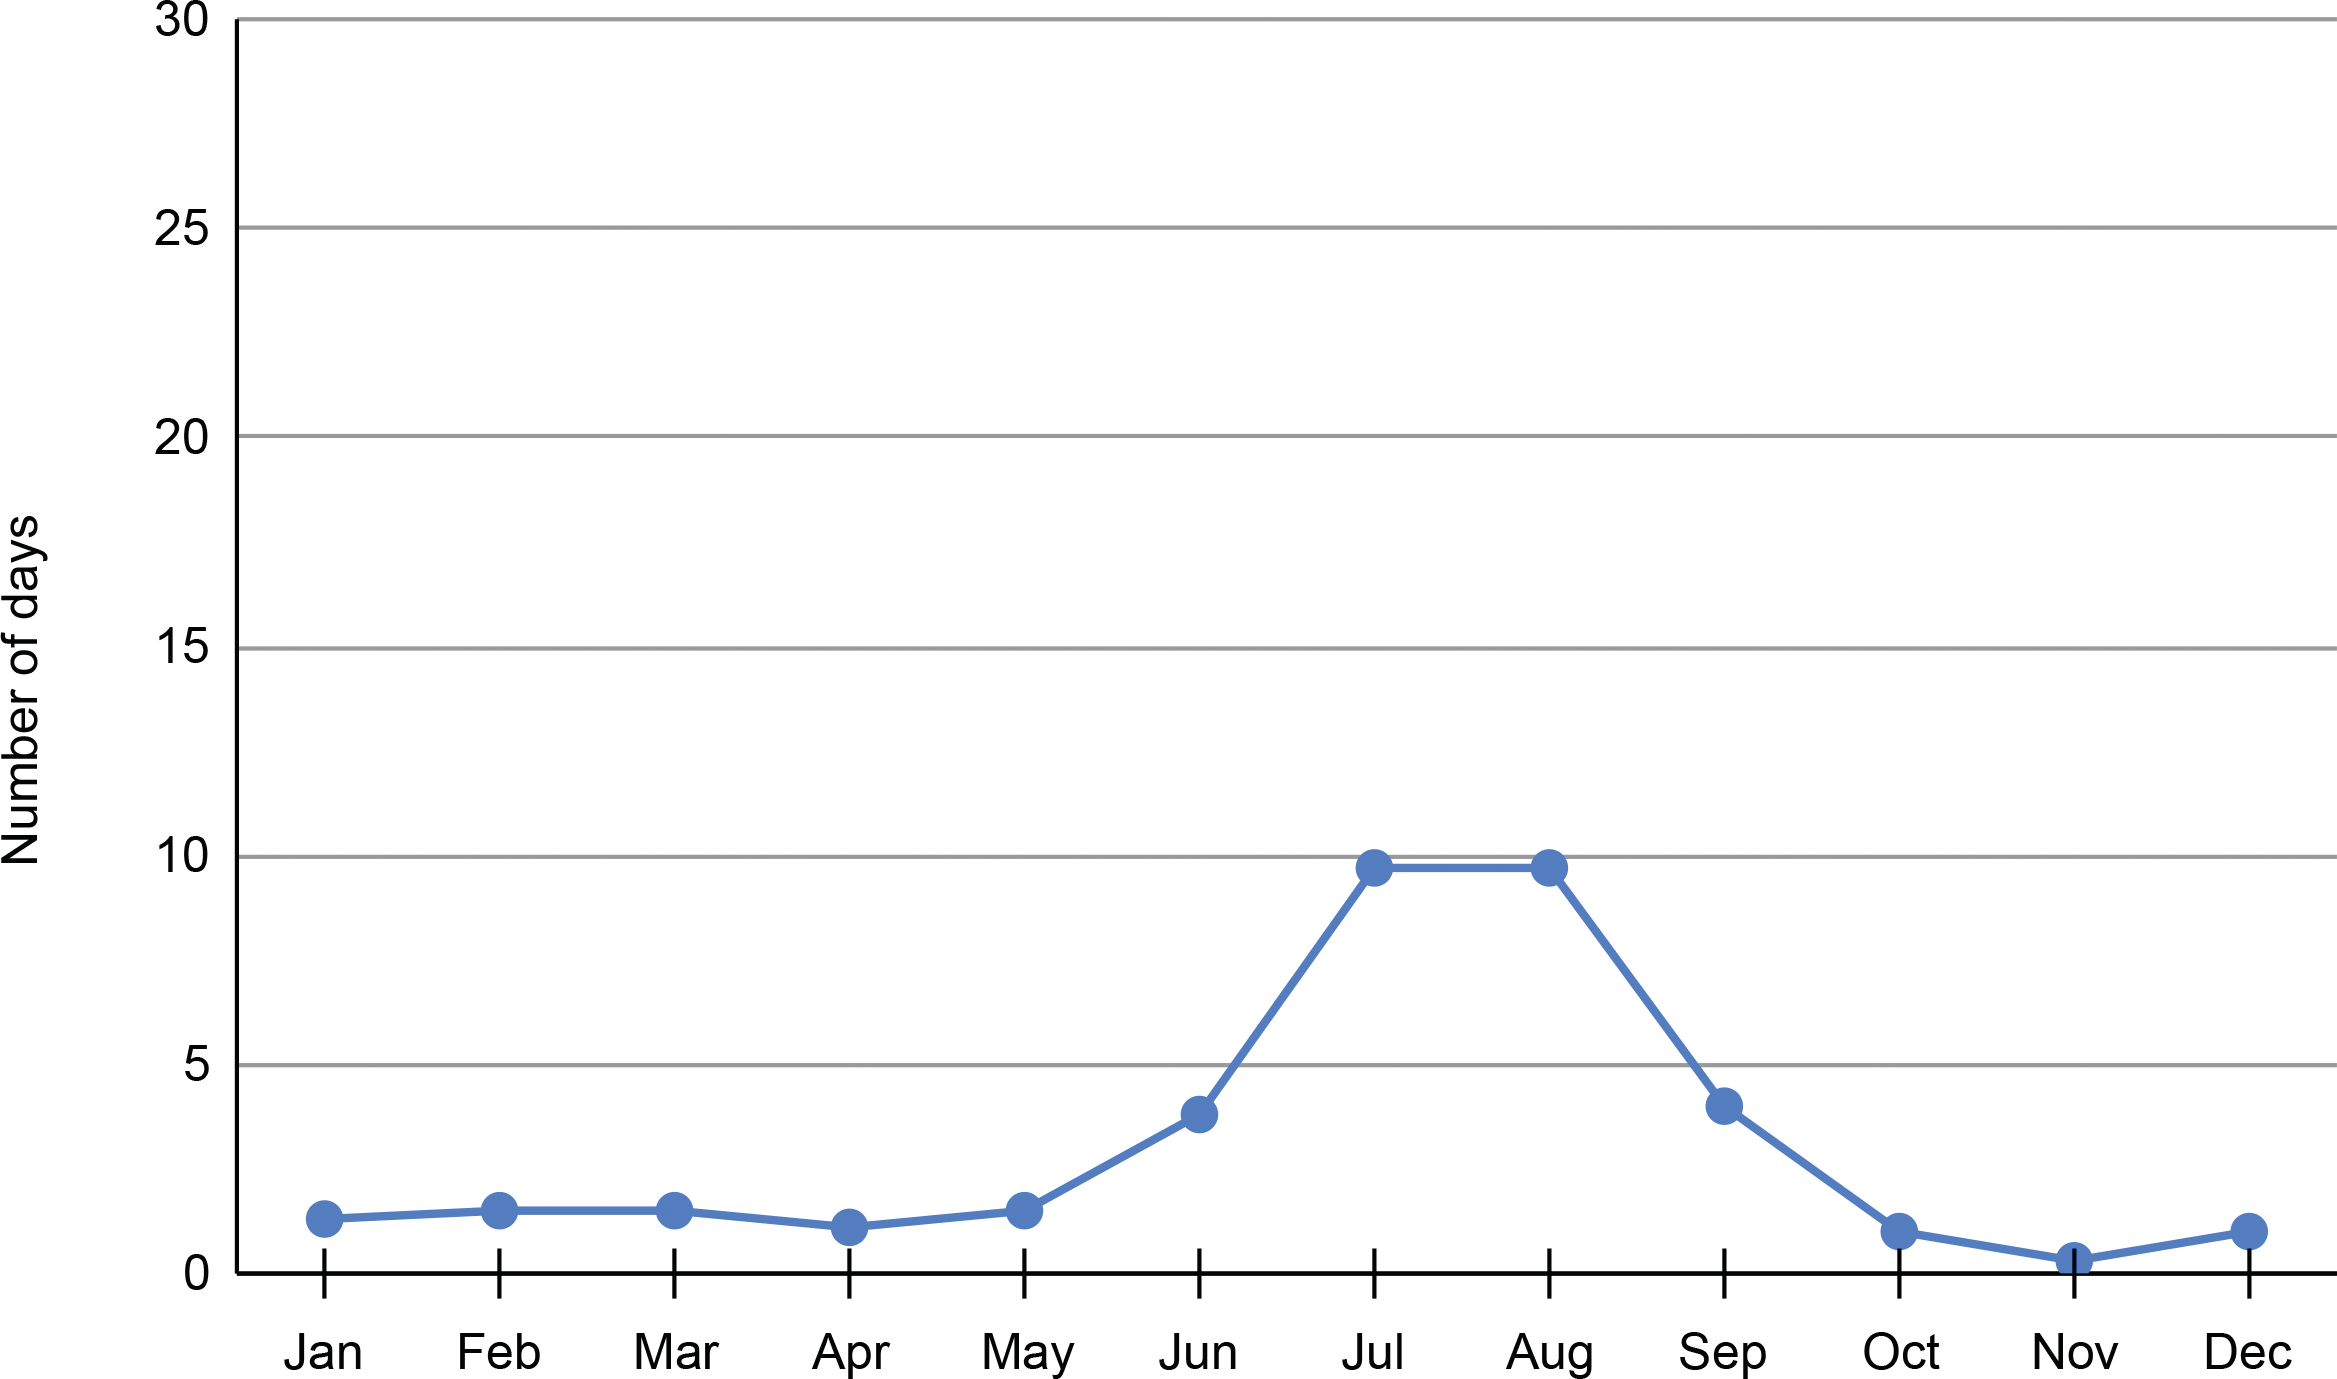
(iii) Reading the New Delhi line gives approximately: Jan 1, Feb 2, Mar 2, Apr 1, May 1, Jun 4, Jul 10, Aug 10, Sep 4, Oct 1, Nov 0, Dec 1 rainy days.
(iv) Port Blair receives the most rainy days in the year (about 126), and New Delhi the fewest (about 37 on these readings).
(v) New Delhi's rainy season is the monsoon period of July and August, with June and September also showing elevated counts. Rameswaram's rainy season is October to December, peaking in November.
3.2.3 FIO 2, Q2 continued: births in India
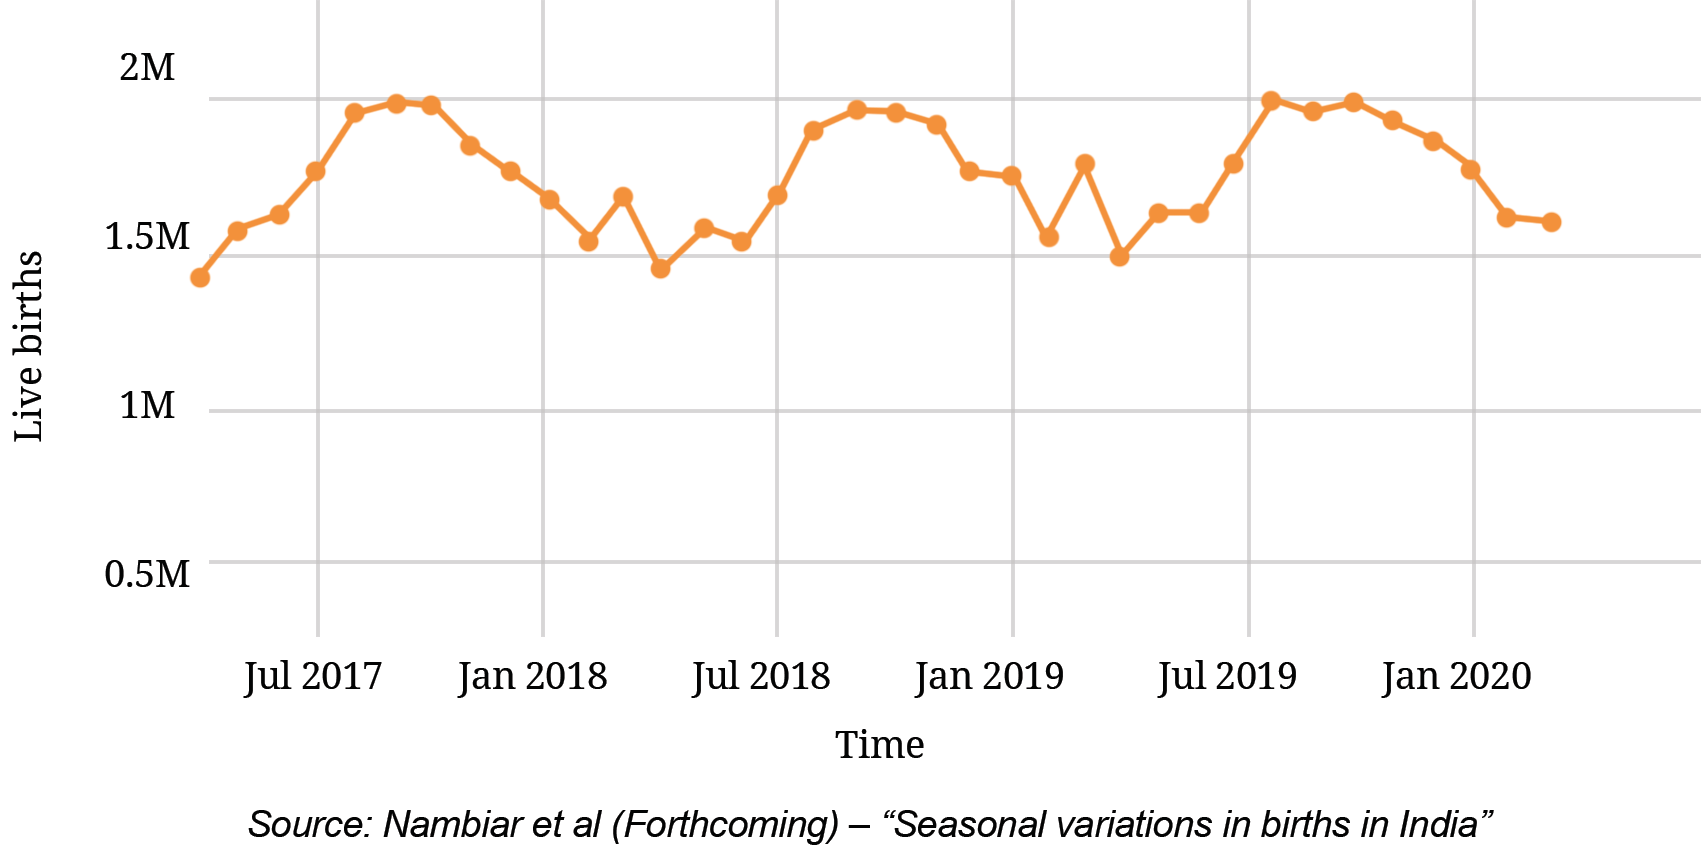
(i) Observations: the births line rises and falls in a repeating yearly pattern. The highest counts are about 1.9 to 2.0 million in the months around September to November, and the lowest are about 1.4 to 1.5 million around June to August and again in February to March. The shape repeats each year, which suggests a seasonal pattern rather than a one-off rise.
(ii) In July 2017 the graph is at about 1.8 million births (reading the point above Jul 2017; the graph starts a few months before that label).
(iii) The graph covers about 36 months, roughly from April 2017 to March 2020.
(iv) The January values are all close together: about 1.7 million in January 2018, about 1.75 million in January 2019 and about 1.8 million in January 2020, so the January count rose only slightly across the three years.
(v) Adding the twelve monthly values for 2019 gives about 21.4 million births for the year.