

Methods and worked examples: Tales by Dots and Lines
Tales by Dots and Lines22 min readLesson 2 of 7
2.1 Changing the data, changing the centre
Adding a value larger than the mean pulls the mean up; adding a value smaller than the mean pulls it down; adding a value exactly equal to the mean leaves the mean unchanged. Removing a value does the opposite: remove a large value and the mean falls, remove a small value and it rises. The median behaves in a similar way but only the middle positions matter, so a value added far outside the middle may not move the median at all.
It is possible to add or remove two values without changing the mean. The two changes must cancel: their total must be zero relative to the old mean. Two values less than the mean and one greater can also leave the mean unchanged if the total still balances. These experiments show the mean as a running balance, not a fixed recipe.
When every value is increased by the same number, the mean increases by that number. When every value is multiplied by the same number, the mean is multiplied by that number. Algebra proves both. If the n values x₁, x₂, …, xₙ have mean a, then adding k to each gives a new total equal to the old total plus nk, and dividing by n gives a + k. Multiplying each value by k multiplies the total by k, so the new mean is ka.
2.2 Finding a value that was lost
Coach Balwan recorded the weights of ten kushti players and their mean, 39.2 kg, but one weight was smudged. Since the mean is 39.2 over 10 players, the total is 39.2 × 10 = 392 kg. The nine readable weights add to 349 kg, so the missing weight is 392 − 349 = 43 kg. The same method works for any missing value: multiply the mean by the count to get the total, then subtract the known values.
Venkayya's coconut harvest gives a variation. The average of 25.6 coconuts per tree over 15 trees was recorded, but one tree's figure had been written 3 more than the truth. The recorded total is 25.6 × 15 = 384; the true total is 381, so the correct average is 381 ÷ 15 = 25.4. Notice that we never needed the individual harvest counts, only the totals.
2.3 Median with cumulative frequencies
For a frequency table, the median is found by adding frequencies from the smallest value until the middle position is reached. In the family-size table there are 36 values, so the median is the average of positions 18 and 19. The cumulative frequency reaches 14 at value 4 and 23 at value 5, so positions 15 to 23 are all 5s; the median is 5. With an odd total, stop at the single middle position instead of averaging two positions.
Spreadsheet software applies the same ideas through formulas. The notation B3:G3 names the range from cell B3 to G3, and =SUM(B3:G3) adds all its values while =AVERAGE(B7:D7) finds the mean of that range. For a whole column, D2:D6 names the five cells in column D. A formula can be filled down or across to repeat the calculation for other rows or subjects. The cell reference changes while the formula stays the same.
2.4 Interpreting line graphs carefully
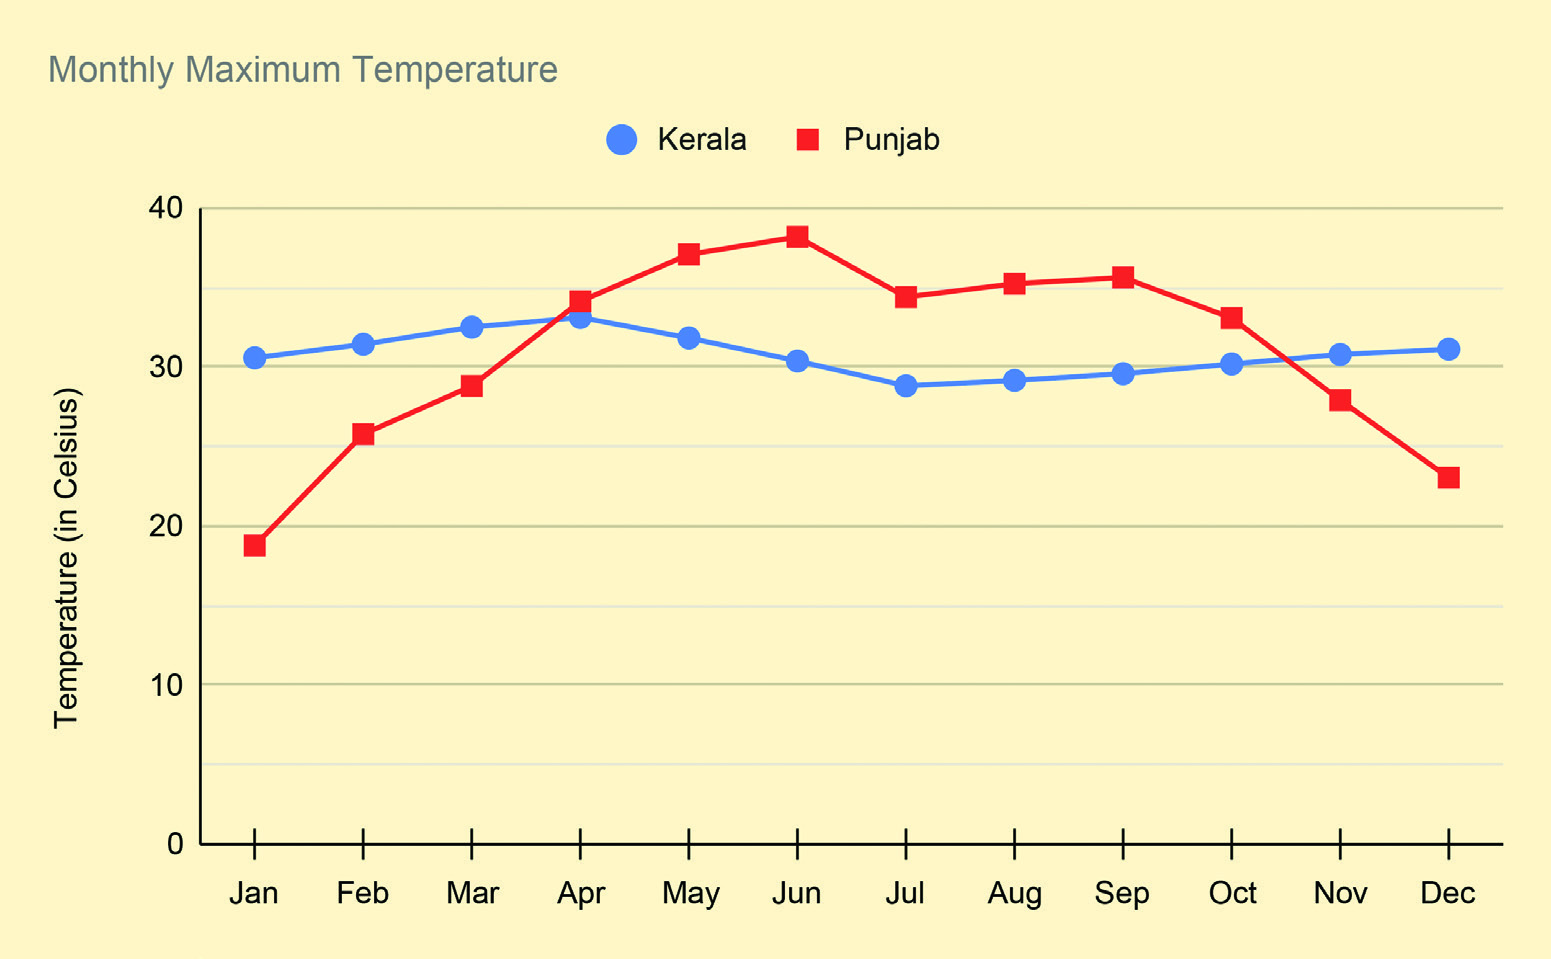
The temperature graph compares Kerala and Punjab month by month. Punjab's line rises from about 19°C in January to about 38°C in June, then falls quickly and reaches about 23°C in December. Kerala's line is almost flat, between about 29°C and 33°C all year. Reading the lines together shows that Punjab has much greater seasonal variation, while Kerala's monthly maximum is steadier.
The space-launch graph shows a worldwide count rising over the years, with country lines that do not add up to the world total. That gap is itself information: other countries are not shown. A steep line segment means a faster increase than a shallow one. The same two-step method applies to any line graph: describe what is plotted and its scale, then support each interpretation with a point or a slope from the graph.
2.5 Matching the graph to the question
Choose the display after deciding what the reader must notice. For a single list of values, a dot plot shows repeats and gaps at a glance. For values grouped into classes, a frequency table or grouped column graph is easier to read. For change across time, a line graph is the natural choice because the eye follows the slope. For parts of a whole, a strip or pie style display works better than a line.
Once a graph is chosen, the scale should not hide the pattern. A vertical axis that starts above zero can make small changes look dramatic, and an axis that starts below the smallest value can flatten a real rise. Always read the labels before judging the size of a change.