

Exercise practice 2: Tales by Dots and Lines
Tales by Dots and Lines26 min readLesson 4 of 7
4.1 Mean grids and data examples
4.1.1 FIO 3, Q1: mean grids
(i) Fill a 3 × 3 grid with nine distinct numbers so that the average in each row, column and diagonal is 10. An average of 10 across three numbers means each line must total 30. Start from the classic 3 × 3 magic square whose lines total 15 (8, 1, 6 / 3, 5, 7 / 4, 9, 2) and add 5 to every entry:
| 13 | 6 | 11 |
|---|---|---|
| 8 | 10 | 12 |
| 9 | 14 | 7 |
Every row, column and both diagonals add to 30, so every average is 10. The nine numbers are distinct.
(ii) Yes, the grid can be changed and still have average 10 in all directions. For example, double the classic square instead of adding 5:
| 16 | 2 | 12 |
|---|---|---|
| 6 | 10 | 14 |
| 8 | 18 | 4 |
Every line still totals 30, so every average is still 10, with different numbers in the grid. In general, any arrangement whose eight lines each sum to 30 works.
4.1.2 FIO 3, Q2: two examples for each condition
(i) Three numbers with mean 8: 6, 8, 10 (sum 24) and 5, 7, 12 (sum 24). (ii) Four numbers with median 15.5: 14, 15, 16, 20 and 12, 15, 16, 18, because the median is the average of the two middle values 15 and 16. (iii) Five numbers with mean 13.6: the sum must be 5 × 13.6 = 68, for example 10, 12, 14, 15, 17 and 13, 13, 14, 14, 14. (iv) Six numbers with mean equal to median: 2, 4, 6, 8, 10, 12 (mean 7, median 7) and 1, 3, 5, 7, 9, 11 (mean 6, median 6). (v) Six numbers with mean greater than median: 1, 2, 3, 4, 5, 30 has mean 45 ÷ 6 = 7.5 and median 3.5; 10, 10, 10, 10, 10, 100 has mean 25 and median 10.
4.1.3 FIO 3, Q3: filling blanks so the median is 13
The collection has six values, so the median is the average of the 3rd and 4th values in order. For it to be 13, those two values must add to 26. The given values 5, 14 and 21 fix where the middle positions can fall. Two patterns work.
Pattern 1: the two middle values are both 13. Then two blanks are 13, and the remaining blank can be any counting number from 1 to 13, giving 13 possibilities. For example 5, 21, 14, 13, 13, 7 sorted becomes 5, 7, 13, 13, 14, 21 and the median is 13.
Pattern 2: the two middle values are 12 and 14. Then one blank is 12, one blank is below 12 (5 itself may serve) and one blank is above 14. For example 5, 21, 14, 12, 3, 20 sorted becomes 3, 5, 12, 14, 20, 21 and the median is (12 + 14) ÷ 2 = 13. The upper blank can be any counting number from 15 upward, so this pattern gives infinitely many fills.
As printed, the question has no finite answer because of pattern 2. The finite answer of 13 belongs to pattern 1 alone, so the note states both and explains the ambiguity rather than hiding it.
4.1.4 FIO 3, Q4: filling blanks so the mean is 6.5
The six values must total 6 × 6.5 = 39. The four known values add to 3 + 11 + 15 + 6 = 35, so the two blanks must add to 4. With positive counting numbers the possibilities are (1, 3), (2, 2) and (3, 1), giving three ordered fills. If the two blanks are allowed to repeat, (2, 2) is valid; if they must be different, only the first and third remain.
4.1.5 FIO 3, Q5: statements about averages
(i) "Two even numbers always have an even mean." Write the numbers as 2a and 2b. Their mean is (2a + 2b) ÷ 2 = a + b, which can be odd: 2 and 4 have mean 3. The statement is false. (ii) "Any two multiples of 5 have a mean that is also a multiple of 5." Write them as 5a and 5b. The mean is 5(a + b) ÷ 2, which need not be a whole multiple of 5: 5 and 10 have mean 7.5. False. (iii) "Any five multiples of 5 have a mean that is a multiple of 5." Write them as 5a₁, …, 5a₅. The total is 5(a₁ + … + a₅), and dividing by 5 gives a₁ + … + a₅, which need not be a multiple of 5: 5, 10, 15, 20 and 30 have total 80 and mean 16. False.
4.1.6 FIO 3, Q6: two new admissions
(i) The correct statement is (c): the two new heights must be measured. The existing total is known from the old mean and the old count, but the new total needs the two new heights. Option (a) is wrong because the new mean may rise or fall, option (b) is wrong for the same reason, and option (d) is unnecessary because the old heights are already summarised. (ii) The old total is 24 × 150.2 = 3604.8 cm. Adding 149 and 152 gives 3905.8 cm over 26 students, so the new mean is about 150.22 cm, slightly above 150.2. The correct option is (b), the average will increase. (iii) Nothing in the summary says where the two new heights would sit among the old heights, so the median may stay or move; the correct option is (d), the information is not sufficient.
4.1.7 FIO 3, Q7: is 17 the average?
Read each cross in the dot plot as one value: 14 appears twice, 15 twice, 16 three times, 17 five times, 18 four times, 19 four times, 20 three times, 21 once and 23 once. That is 25 values. Their sum is 28 + 30 + 48 + 85 + 72 + 76 + 60 + 21 + 23 = 443, so the mean is 443 ÷ 25 = 17.72. The value 17 is not the average; the method is to multiply each value by its frequency, add and divide by the count.
4.1.8 FIO 3, Q8: weights changing by a little
One person lost 2 kg and two gained 1 kg, so the total change is −2 + 1 + 1 = 0. The mean weight therefore stays at 65.3 kg. The median cannot be decided from the given information: the three changed people may or may not include the middle weights, so the median may stay at 67 kg or move. More data about the individual weights is needed.
4.1.9 FIO 3, Q9: iodised salt prices
(i) Choose three states, for example Mizoram, Uttar Pradesh and West Bengal. Put the years 2016 to 2025 on the horizontal axis and price in rupees on the vertical axis, with a scale from 0 to 30 in steps of 5, and draw one line for each state with a different marker.
(ii) Observations: West Bengal's price more than doubled, from about ₹9.5 to ₹24; Mizoram rose steadily from ₹20 to about ₹30; Uttar Pradesh climbed from about ₹16 to ₹25, with a small dip in 2025; Gujarat stayed around ₹14 for many years and then jumped to about ₹19 in 2025.
(iii) Gujarat's price fell slightly at first and then stayed in a narrow band until a sharp 2025 rise, a total change of about ₹2.7 from 2016 to 2025. Uttar Pradesh's price rose almost every year, a change of about ₹8.7. So Uttar Pradesh shows the steadier and larger upward trend, while Gujarat shows a late jump.
(iv) West Bengal had the largest increase from 2016 to 2025, about ₹14.5 (from ₹9.47 to ₹23.99).
(v) One might ask why the jump in Gujarat happened in 2025, whether the prices reflect transport costs or local taxes, and whether other food items show the same pattern.
4.1.10 FIO 3, Q10: the lighting graphs
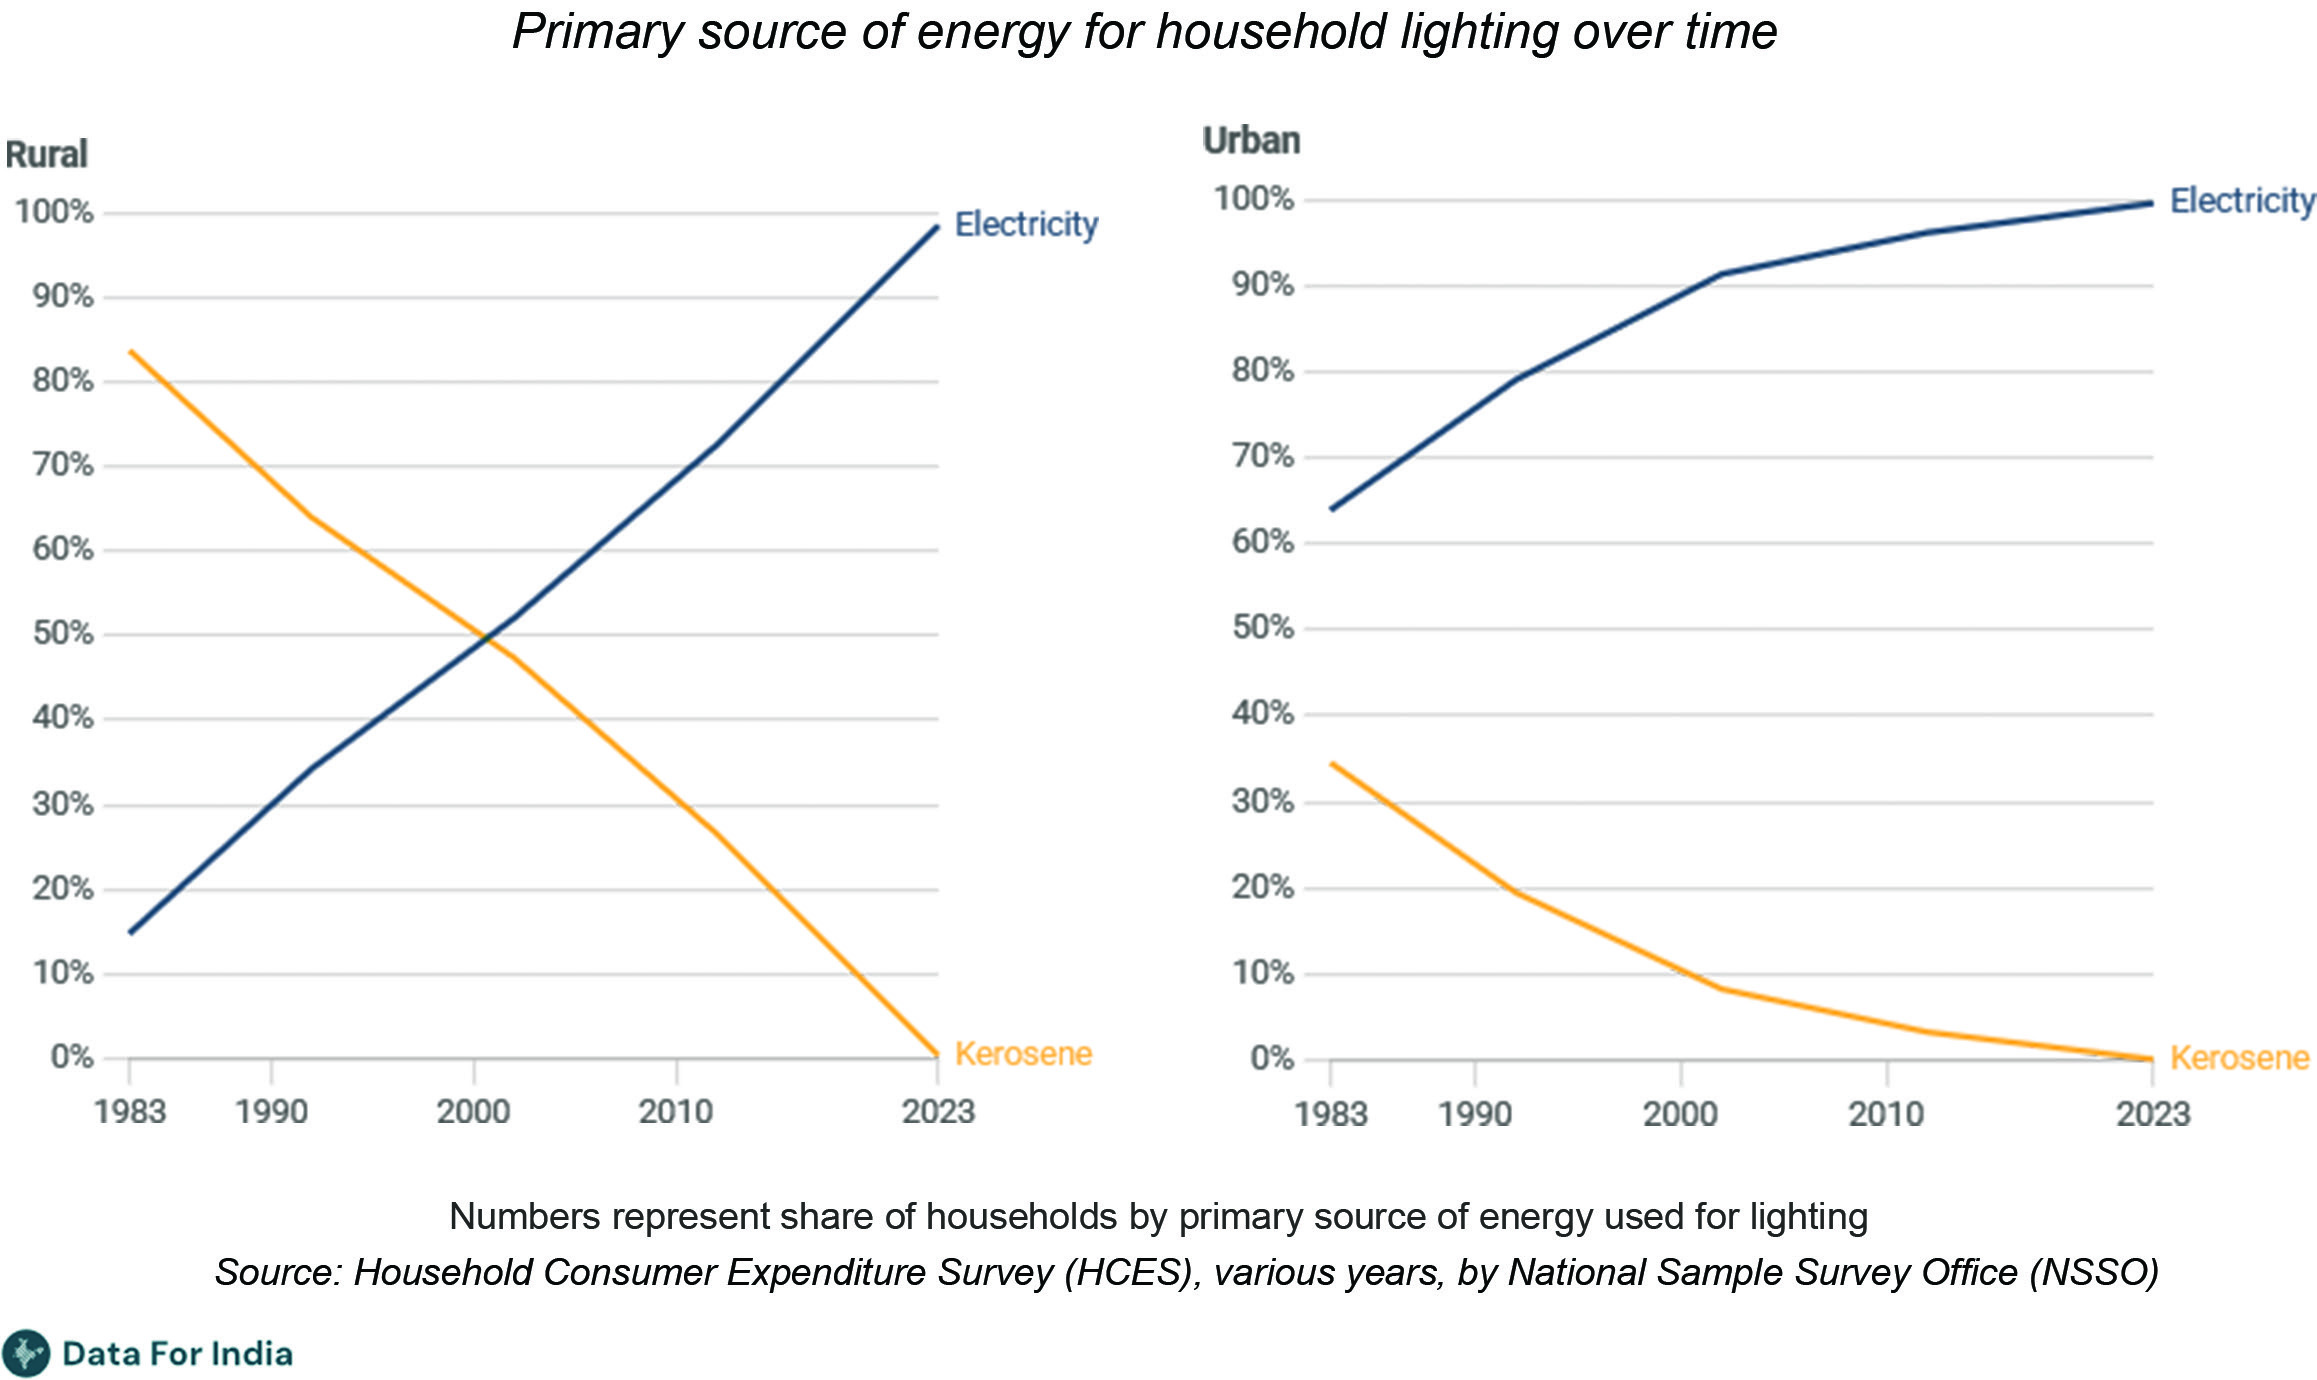
(i) Valid. In 1983 the rural graph shows kerosene above 80% and electricity under 20%; the urban graph shows electricity around 65% and kerosene around 35%, so the majorities were kerosene in rural areas and electricity in urban areas. (ii) Valid. The kerosene line falls in both graphs over the years, reaching nearly zero by 2023. (iii) Invalid. In 2000 the urban electricity line is near 90%, not 10%; the 10% figure belongs to the falling kerosene line. (iv) Invalid. The graphs record the share of households using each lighting source, not whether power cuts happened. No conclusion about power cuts can be drawn from them.
4.1.11 FIO 3, Q11: hobbies and games
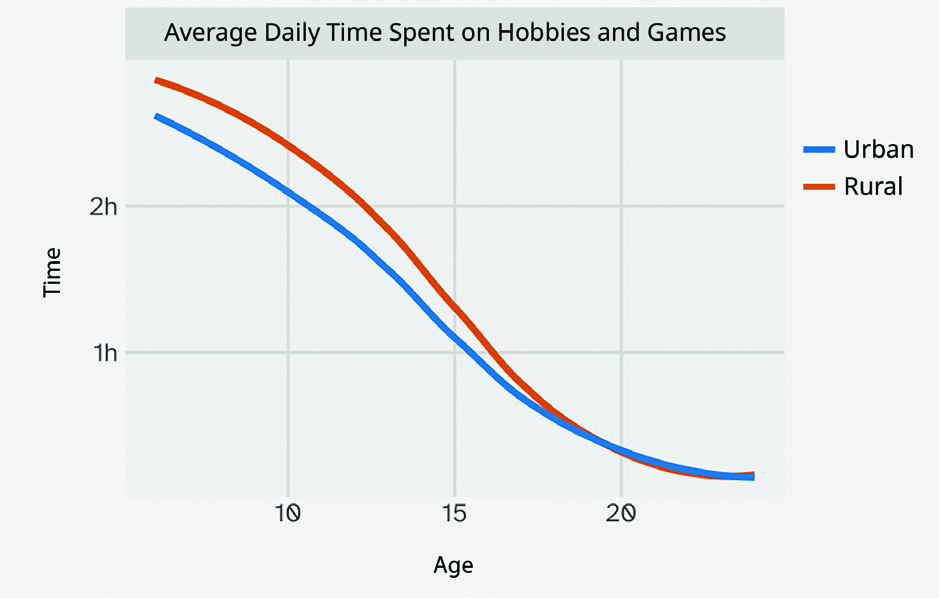
(i) At age 10, the urban line is about 1.6 hours per day. (ii) The rural line reaches 1.5 hours per day at about age 12, so the correct option is (c). (iii) (a) False. At age 15 the urban line is about 1.0 hour, while at age 10 it is about 1.6 hours, so the time at 15 is not twice the time at 10; it is smaller. (b) False. The graph shows averages, not individual children. Some rural 15-year-olds may spend less than an hour, and the average alone cannot rule that out.
4.1.12 FIO 3, Q12: the individual activity-strip project
(i) Record each day for a week and note whether eating and sleeping happen at regular times and how much time is spent outdoors. (ii) Convert each activity's weekly time into a daily average, then draw a 48-box strip (each box half an hour) with colours for sleep, meals, classes and study, screen or hobby time, exercise, travel and so on. (iii) Repeat the record for an adult at home and compare the two strips. The comparison usually shows how school, work and sleep shift between ages; the values are personal data, so exact totals differ from person to person.
4.1.13 FIO 3, Q13: the group sleep-timing project
(i) Each member records family sleep for a week, including naps. Draw strips for each person, pool the group's data, and compute mean and median sleep for children, adults and the elderly. Sharing the findings shows how sleep changes with age. (ii) Collect start and end times of Grade 8 schools, including class and break time. Manoj's school runs from 9:30 am to 4:30 pm, 7 hours in all. Present the collected timings as a table or graph and compare totals; this exercise is about collecting and organising real data carefully.
4.1.14 FIO 3, Q14: sunrise and sunset
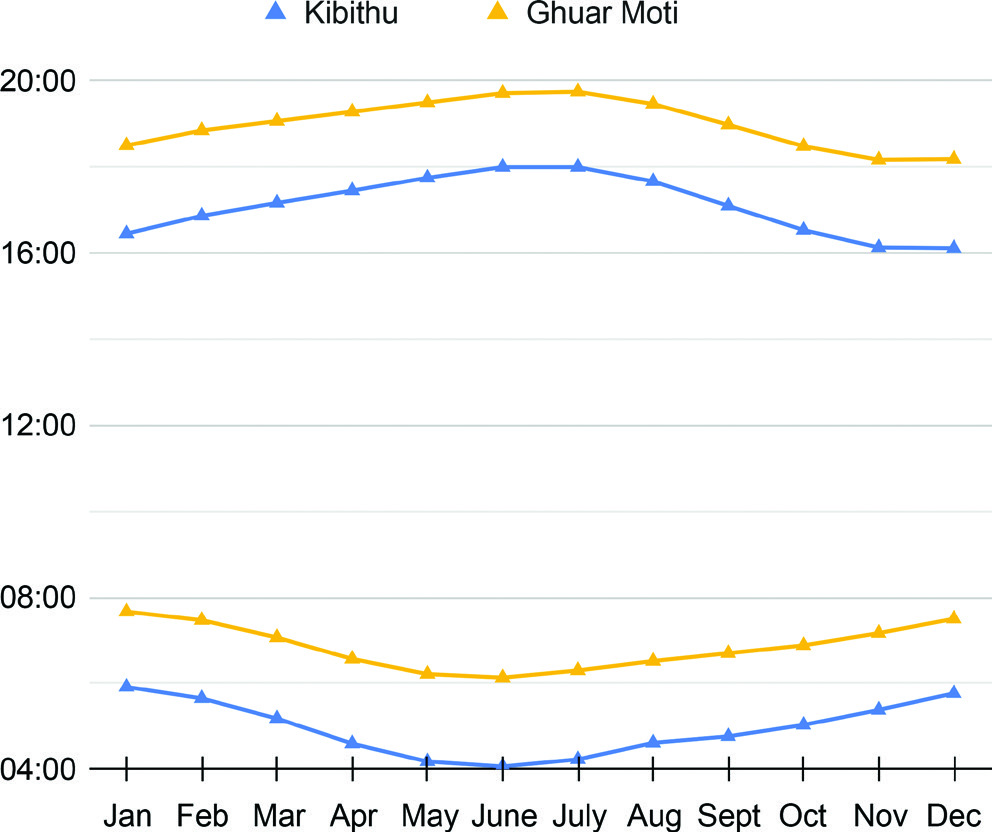
(i) In January the earliest sunrise is at Kibithu in Arunachal Pradesh, at about 4:45 am. Its sunset is then about 4:20 pm, so the day is about 11.5 hours long. (ii) Srinagar has the longest day of the year: around June its sunrise is about 5:20 am and its sunset about 7:40 pm, a day of about 14.3 hours. Kanyakumari, being far south, has a much steadier day length. (iii) Interesting observations: the eastern place has earlier sunrise and sunset, while the northern place has the biggest difference between summer and winter day lengths; all four places have their longest days around June and shortest around December.
4.1.15 FIO 3, Q15: the moonrise graph
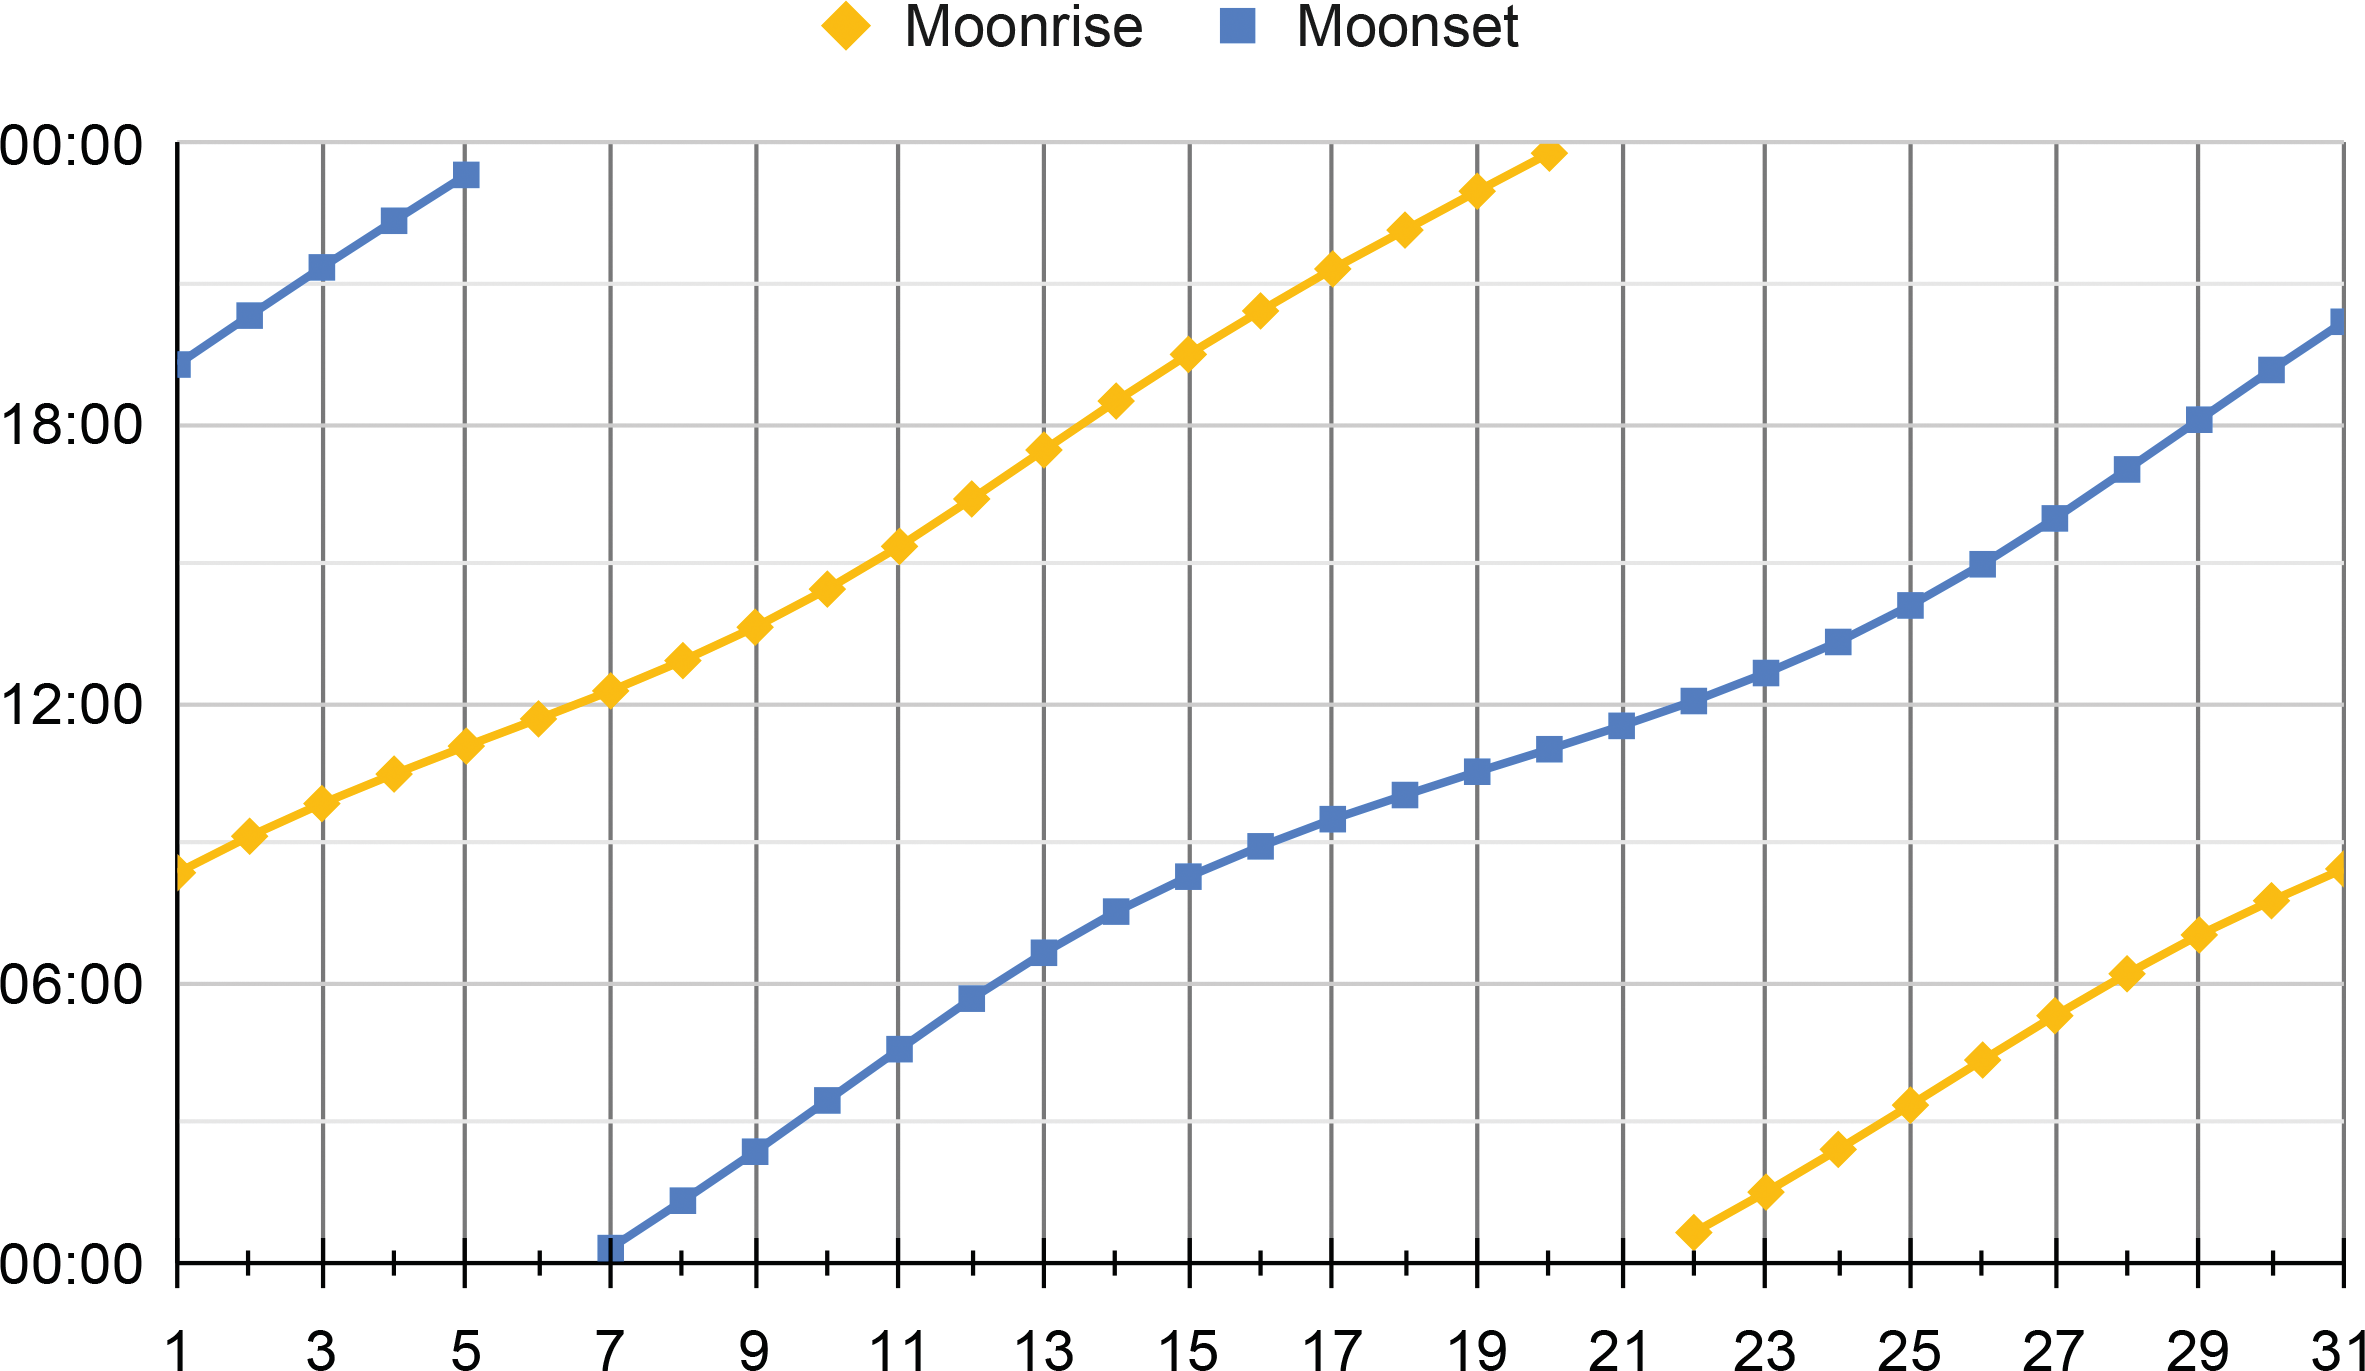
(i) Purnima (full moon) is around day 14 to 15, when the moon rises near sunset and sets near sunrise. Amavasya (new moon) is around day 28 to 29, when the moon rises near sunrise and sets near sunset.
(ii) Notice that moonrise and moonset become later by roughly 50 minutes each day, so their lines climb across the month and then reset once the cycle repeats. The two resets are about a fortnight apart, which matches the change from full moon to new moon. What one wonders next is why the Moon's daily delay differs from the Sun's steady pattern, and whether the same graph looks the same in every month.